

New Workforce Analytics Statistics, Trends, and Predictions for 2026


Workforce analytics has become core infrastructure for running distributed teams. Leaders use it to protect focus time, flag burnout early, plan headcount, and prove that work is getting done. What used to be a quarterly HR report is now a daily operating tool.
At Modge, we compiled 25 workforce analytics statistics that show how fast the market is growing, where adoption is strongest, and why companies are moving away from surveillance and toward analytics that help people work better. Every figure comes from an independent source, linked beneath the statistic.
Key takeaways: The workforce analytics market is set to nearly triple to $7.12 billion by 2034. Only 20% of employees are engaged, and disengagement costs the global economy about $10 trillion a year. Hybrid work cut quit rates by a third in a controlled trial, while monitored employees are far likelier to feel stressed and plan to leave.
In this article
Key Workforce Analytics Statistics
1. The workforce analytics market is set to nearly triple this decade
The global workforce analytics market was worth roughly $2.37 billion in 2025. By 2034 it is projected to reach $7.12 billion, a compound annual growth rate (CAGR) of 12.78%. North America held about 40% of spending in 2025.
Growth like that does not come from companies buying dashboards for fun. It tracks the spread of teams across cities and time zones, with managers reaching for data because the old in-person signals are gone.
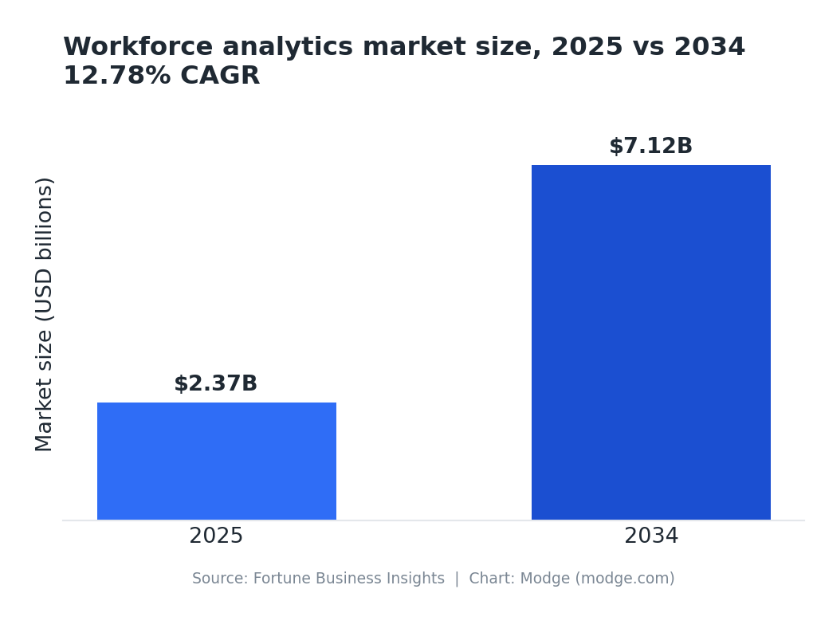
Bar chart showing the workforce analytics market growing from $2.37 billion in 2025 to $7.12 billion in 2034, a 12.78% compound annual growth rate.
Chart: Modge, based on Fortune Business Insights data. Free to republish with a link back to this page.
Source: Fortune Business Insights.
2. Use of monitoring tools doubled to 60% during the pandemic
Before COVID-19, about 30% of medium and large employers used worker monitoring software. By the end of 2021 that number had doubled to roughly 60%, and Gartner expected it to hit 70% within a few years.
What pushed the spike was not suspicion so much as blindness. When everyone went home overnight, managers lost the cues they relied on, and software became the fastest way to get them back.
Source: Gartner, reported by the BBC and AARP.
3. Only 23% of HR teams say they are effective at people analytics
Buying the tools is one thing. Using them well is another. Just 23% of HR professionals rate their organization as very or extremely effective at getting value from people analytics, a number that has barely moved in years and actually sits below where it was in 2021.
Source: HR.com, State of People Analytics 2025.
4. About 83% of organizations admit their analytics maturity is low
Most companies know they are behind. In Deloitte’s global research, 83% of the 924 companies surveyed had low people-analytics maturity, stuck at basic descriptive reporting rather than the predictive or prescriptive insight the tools promise.
The gap between owning analytics software and acting on it is where most of the opportunity still sits.
Source: Deloitte people analytics maturity research.
5. Most companies still do not track where or how much people work
Here is the catch. A U.S. Census Bureau survey of more than 150,000 businesses found that 70% of firms do not check whether employees meet onsite requirements, and 75% do not track how much their people work from home.
Adoption is climbing fast, but plenty of organizations are still flying blind. The tools exist. The actual insight, for a lot of leaders, does not yet.
Source: U.S. Census Bureau Business Trends and Outlook Survey / Stanford SIEPR.
Remote and Hybrid Work Statistics
6. Nearly a quarter of U.S. workers teleworked in 2025
Government data puts the telework rate at 22.4% of people at work in 2025. Of the total, 10.5% worked entirely from home and another 11.9% split their hours between home and the office.
Source: U.S. Bureau of Labor Statistics.
7. Work from home is about a quarter of all paid workdays
Stanford economists put working from home at roughly 25% of all paid workdays in the United States as of 2025. That share has held steady, not snapped back to the office the way some predicted.
A quarter of work now happens somewhere a manager cannot watch. That single fact explains most of why this category exists.
Source: Stanford Work From Home Research (Barrero, Bloom, Davis) / NBER.
8. By spring 2025, the split was 60% onsite, 27% hybrid, 13% fully remote
Among U.S. full-time employees in spring 2025, 60% worked fully onsite, 27% were hybrid, and 13% were fully remote.
For knowledge workers who can work remotely, hybrid is the default. Most teams are scattered across home and office on any given day, which happens to be the hardest setup to manage by walking around.
Source: Stanford Work From Home Research (SWAA).
9. Companies see no real productivity gap between remote and onsite work
When the Census Bureau asked businesses straight out, the most common answer was that remote and onsite workers are about equally productive. Only around 7% of firms said onsite was more productive, against roughly 2% who said remote was. Everyone else saw no difference.
If location barely moves the needle on output, it is a strange thing to spend a measurement budget on. Better to measure the work.
Source: U.S. Census Bureau Business Trends and Outlook Survey / Stanford SIEPR.
10. Hybrid work cut quit rates by a third without hurting performance
In a randomized controlled trial of 1,612 employees published in Nature, letting people work from home two days a week dropped the quit rate from 7.2% to 4.8%, a one-third reduction. Performance reviews, promotions, and the lines of code engineers shipped all held steady.
This is the gold-standard study on the question, and it lands on the side of flexibility paying off.
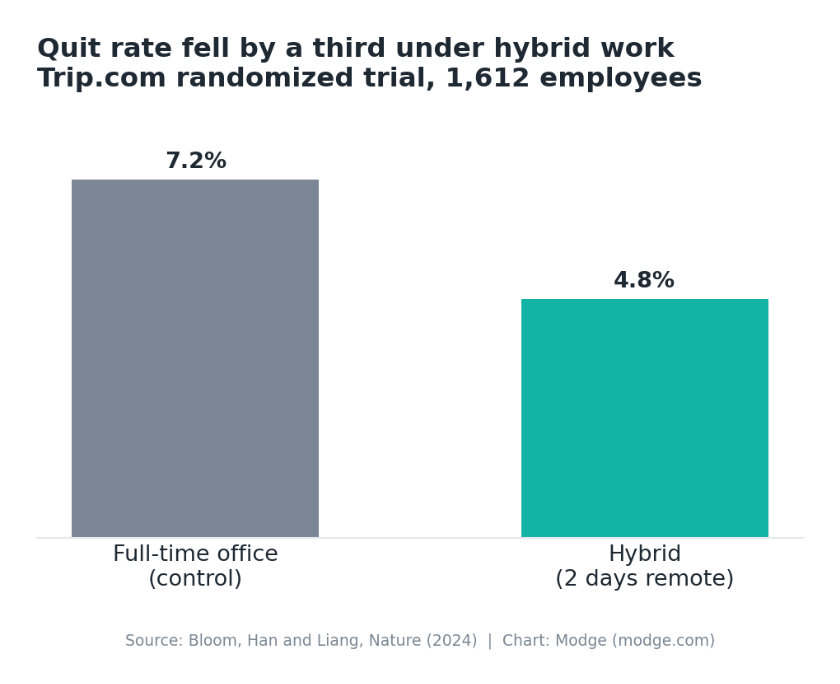
Bar chart comparing employee quit rates: 7.2% for full-time office workers versus 4.8% for hybrid workers in the Trip.com randomized trial, a one-third reduction.
Chart: Modge, based on Bloom, Han and Liang, Nature (2024). Free to republish with a link back to this page.
Source: Bloom et al., Nature (2024).
11. Managers flipped their opinion of hybrid work after trying it
In that same trial, the 395 managers went in skeptical and came out converted. Before the experiment they guessed hybrid work hurt productivity by about 2.6%. Afterward they estimated it helped by roughly 1%.
Source: Bloom et al., Nature (2024).
Productivity, Focus, and Engagement Statistics
12. Just 20% of employees are engaged, and disengagement costs about $10 trillion
Gallup’s 2026 report found that only 20% of employees worldwide are engaged. Another 64% are not engaged, and 16% are actively disengaged. The price tag on all that checked-out work is roughly $10 trillion in lost productivity, about 9% of global GDP.
Engagement is the thing every other metric is supposed to protect. A team can hit all its activity targets and still be quietly walking out the door.
Source: Gallup, State of the Global Workplace 2026.
13. Remote workers are the most engaged group
Engagement tracks with arrangement in a way that surprises people. Gallup found it highest among exclusively remote employees at 30%, then hybrid at 25%, onsite-but-remote-capable at 24%, and lowest among onsite workers who cannot work remotely, at 17%.
So much for the idea that being in the room makes people care more. How a team is led beats where it sits.

Bar chart of employee engagement by work location in 2025: 30% exclusively remote, 25% hybrid, 24% on-site remote-capable, and 17% on-site non-remote-capable.
Chart: Modge, based on Gallup State of the Global Workplace 2026 data. Free to republish with a link back to this page.
Source: Gallup, State of the Global Workplace 2026 (work location data).
14. Managers drive 70% of the difference in team engagement
Gallup’s analysis across millions of teams found that managers account for at least 70% of the variance in employee engagement. More than pay, perks, or company policy, the manager decides whether a team is engaged.
That is why the most useful analytics point at the team and the manager, not just the individual.
Source: Gallup, State of the American Manager.
15. Highly engaged teams are 23% more profitable
Engagement is not a soft metric. Gallup’s meta-analysis of millions of workers found that top-quartile engaged business units deliver 23% higher profitability and 18% higher productivity, along with lower turnover, absenteeism, and defects than bottom-quartile units.
Source: Gallup Q12 meta-analysis.
16. 53% of leaders want more output while 80% of workers feel tapped out
Microsoft’s 2025 Work Trend Index called this the “capacity gap.” 53% of leaders say productivity has to increase, while 80% of the global workforce say they do not have the time or energy to do their work as it is. The average worker, Microsoft found, gets interrupted about every two minutes, which adds up to roughly 275 interruptions a day.
You cannot squeeze more out of a day that is already in pieces. Catching that fragmentation early is exactly what analytics is good for, before it turns into burnout or a resignation.
Source: Microsoft Work Trend Index 2025.
17. Workers switch screens every 47 seconds and need 23 minutes to refocus
Decades of attention research from UC Irvine’s Gloria Mark show that people now spend an average of just 47 seconds on a screen before switching (a median of 40 seconds), down from about two and a half minutes in 2004. Once interrupted, it can take around 23 minutes to return fully to the original task.
Real focus is the scarce resource, and almost nobody has enough of it. That is the signal worth measuring and protecting.
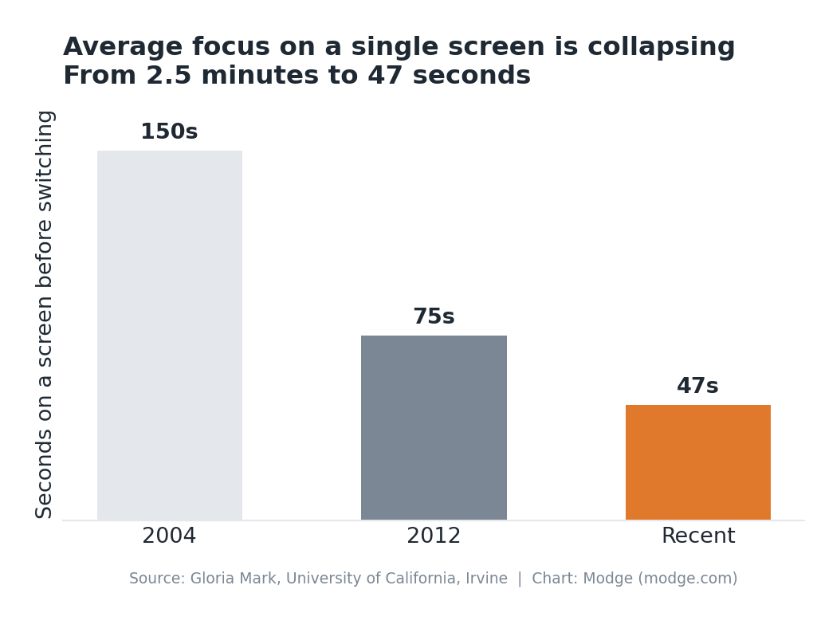
Bar chart showing average focus on a single screen falling from 150 seconds in 2004 to 75 seconds in 2012 to 47 seconds in recent years.
Chart: Modge, based on Gloria Mark, University of California, Irvine. Free to republish with a link back to this page.
Source: Gloria Mark, University of California, Irvine.
Trust, Privacy, and Monitoring Statistics
18. 87% of employees feel productive. Only 12% of leaders believe them.
Microsoft coined “productivity paranoia” to describe this split. 87% of employees say they are productive, but only 12% of leaders are fully confident that they are. On top of that, 85% of leaders said hybrid work made it hard to feel sure their people were getting things done.
That trust deficit sells a lot of monitoring software. It is also why tools that earn trust, instead of just watching, are starting to stand out.
Source: Microsoft Work Trend Index 2022.
19. Monitored workers report more stress, more micromanagement, and more interest in leaving
The American Psychological Association found that workers who know they are being monitored are far likelier to feel tense or stressed on a normal day (51% versus 38%), to feel micromanaged (47% versus 23%), and to say they plan to job-hunt in the next year (39% versus 21%).
Monitoring is not automatically toxic. How you do it decides everything. Done quietly or punitively, it pushes your best people toward the exit.

Grouped bar chart comparing monitored and unmonitored workers: 51% versus 38% feel stressed, 47% versus 23% feel micromanaged, and 39% versus 21% plan to job-hunt this year.
Chart: Modge, based on American Psychological Association, Work in America. Free to republish with a link back to this page.
Source: American Psychological Association, Work in America.
20. Fewer workers realize they are being monitored
The same APA research turned up something uncomfortable. The share of workers who say their employer monitors them slipped to 44% in 2024, down from 51% in 2023 and 53% in 2022, even though companies kept buying more monitoring tools over those same years.
More watching, less awareness of it. That is the recipe for a backlash, and for the regulators who tend to follow one.
Source: American Psychological Association, Work in America.
21. Most Americans are against AI tracking of workers
Pew Research Center found broad opposition. 61% of U.S. adults oppose employers using AI to track workers’ movements, and 56% oppose tracking whether office workers are at their desks. 81% think this kind of monitoring would make people feel inappropriately watched, and 66% expect the data to be misused at some point.
Public mood usually shows up in law and in hiring before it shows up anywhere else. Right now it is running against blanket surveillance.
Source: Pew Research Center.
Workforce Analytics Trends and Predictions
22. The market is forecast to keep compounding at double digits
Forecasters expect strong growth ahead. Grand View Research pegs the CAGR at about 15.3% through 2030, Technavio at 20.2% from 2025 to 2030, both crediting AI and predictive analytics. Market Research Future sees the market reaching $11.2 billion by 2035.
Source: Grand View Research; Technavio; Market Research Future.
23. Regulators are starting to draw lines around worker-tracking AI
The rules are tightening. Under the EU AI Act, software used to evaluate workers counts as “high-risk” and is soon to carry real transparency and oversight obligations. Vendors that built their products around blanket capture with no way to opt out will have the hardest time adapting.
Source: European Union AI Act.
24. 39% of workers’ core skills will change by 2030
The World Economic Forum expects 39% of workers’ core skills to change or fall out of date by 2030. Analytical thinking now tops the list of skills employers say they need, named essential by 7 in 10 companies.
As the work itself shifts, the value of understanding how it actually gets done only goes up.
Source: World Economic Forum, Future of Jobs Report 2025.
25. Only 6% of organizations feel they are getting the people side right
Despite all the data now available, just 6% of organizations say they are making great progress on “human sustainability,” the goal of creating real value for the people connected to the business. AI is pushing analytics from backward-looking reports toward predicting burnout and attrition before they hit.
The companies that close that gap will be the ones using analytics to help people, not just to watch them.
Source: Deloitte Global Human Capital Trends 2025.
What These Statistics Reveal
A few things stand out when you put the numbers side by side.
Workforce analytics has become standard equipment for distributed teams, growing at double-digit rates and still concentrated in North America. Yet most companies admit they are not good at it yet, and a striking share do not formally track their own people at all. Owning the tools and getting value from them are very different stages.
Location, it turns out, is a weak predictor of productivity. Independent and peer-reviewed research keeps showing little to no difference between remote and onsite output, and the clearest finding of all is that hybrid flexibility cuts turnover without costing performance. Engagement, not hours, is the metric that actually predicts whether a team thrives, and managers move that number more than anything else.
Surveillance has a ceiling. Heavy monitoring lines up with more stress, more micromanagement, and a stronger urge to quit. Most of the public wants nothing to do with AI tracking, and regulators are beginning to fence it in. The tools worth betting on are the ones that help people do better work and stay transparent about how they do it.
Frequently Asked Questions
What percentage of employees are engaged at work in 2026?
About 20% of employees worldwide are engaged, according to Gallup’s State of the Global Workplace 2026. Another 64% are not engaged and 16% are actively disengaged.
How much does low employee engagement cost?
Roughly $10 trillion a year in lost productivity, equal to about 9% of global GDP, according to Gallup.
Are remote workers less productive than office workers?
No. Most firms report no productivity difference between remote and onsite work (U.S. Census Bureau), and a randomized trial published in Nature found hybrid work cut quit rates by a third with no drop in performance.
Does employee monitoring improve productivity?
The evidence is mixed at best. Monitored workers report more stress, more micromanagement, and a stronger intent to quit (APA), and most Americans oppose AI-based tracking (Pew). Analytics that focus on workflow and focus time, with transparency, tend to hold up better than surveillance.
How big is the workforce analytics market?
About $2.37 billion in 2025, projected to reach $7.12 billion by 2034 at a 12.78% CAGR, according to Fortune Business Insights.
What is workforce analytics?
Workforce analytics is the practice of using data on how work actually happens, including focus time, workload, engagement, and attrition risk, to manage and improve distributed teams instead of relying on in-person observation.
How Modge Can Help
Modge is a workforce analytics platform for distributed teams, built around augmentation instead of surveillance. Rather than counting keystrokes to catch people slacking, it surfaces the patterns that actually move output: where focus time leaks away, where workflows snarl up, and where burnout or attrition is starting to build. Leaders get to fix the work itself.
If you want visibility your team trusts and data that improves how the work gets done, see how Modge works.
Mendel Jacks writes about workforce analytics, productivity, and the future of distributed work at Modge, a workforce analytics platform built for distributed teams.
Sources
- Gartner monitoring adoption, via BBC Worklife and AARP
Table of contents


Ready to see Modge in action?
Start your free 14-day trial or book a personalized demo with our team today.
.svg)


