See Which App & URL Actually Drive Work

Modge automatically captures the apps and websites your team uses during tracked sessions, classifies each one as productive, neutral, or unproductive, and rolls everything into the dashboards your managers actually open. Real context behind every hour, in real time.

vector

Free 14-day trial

vector

No screenshots or keylogging

vector

Privacy-first design

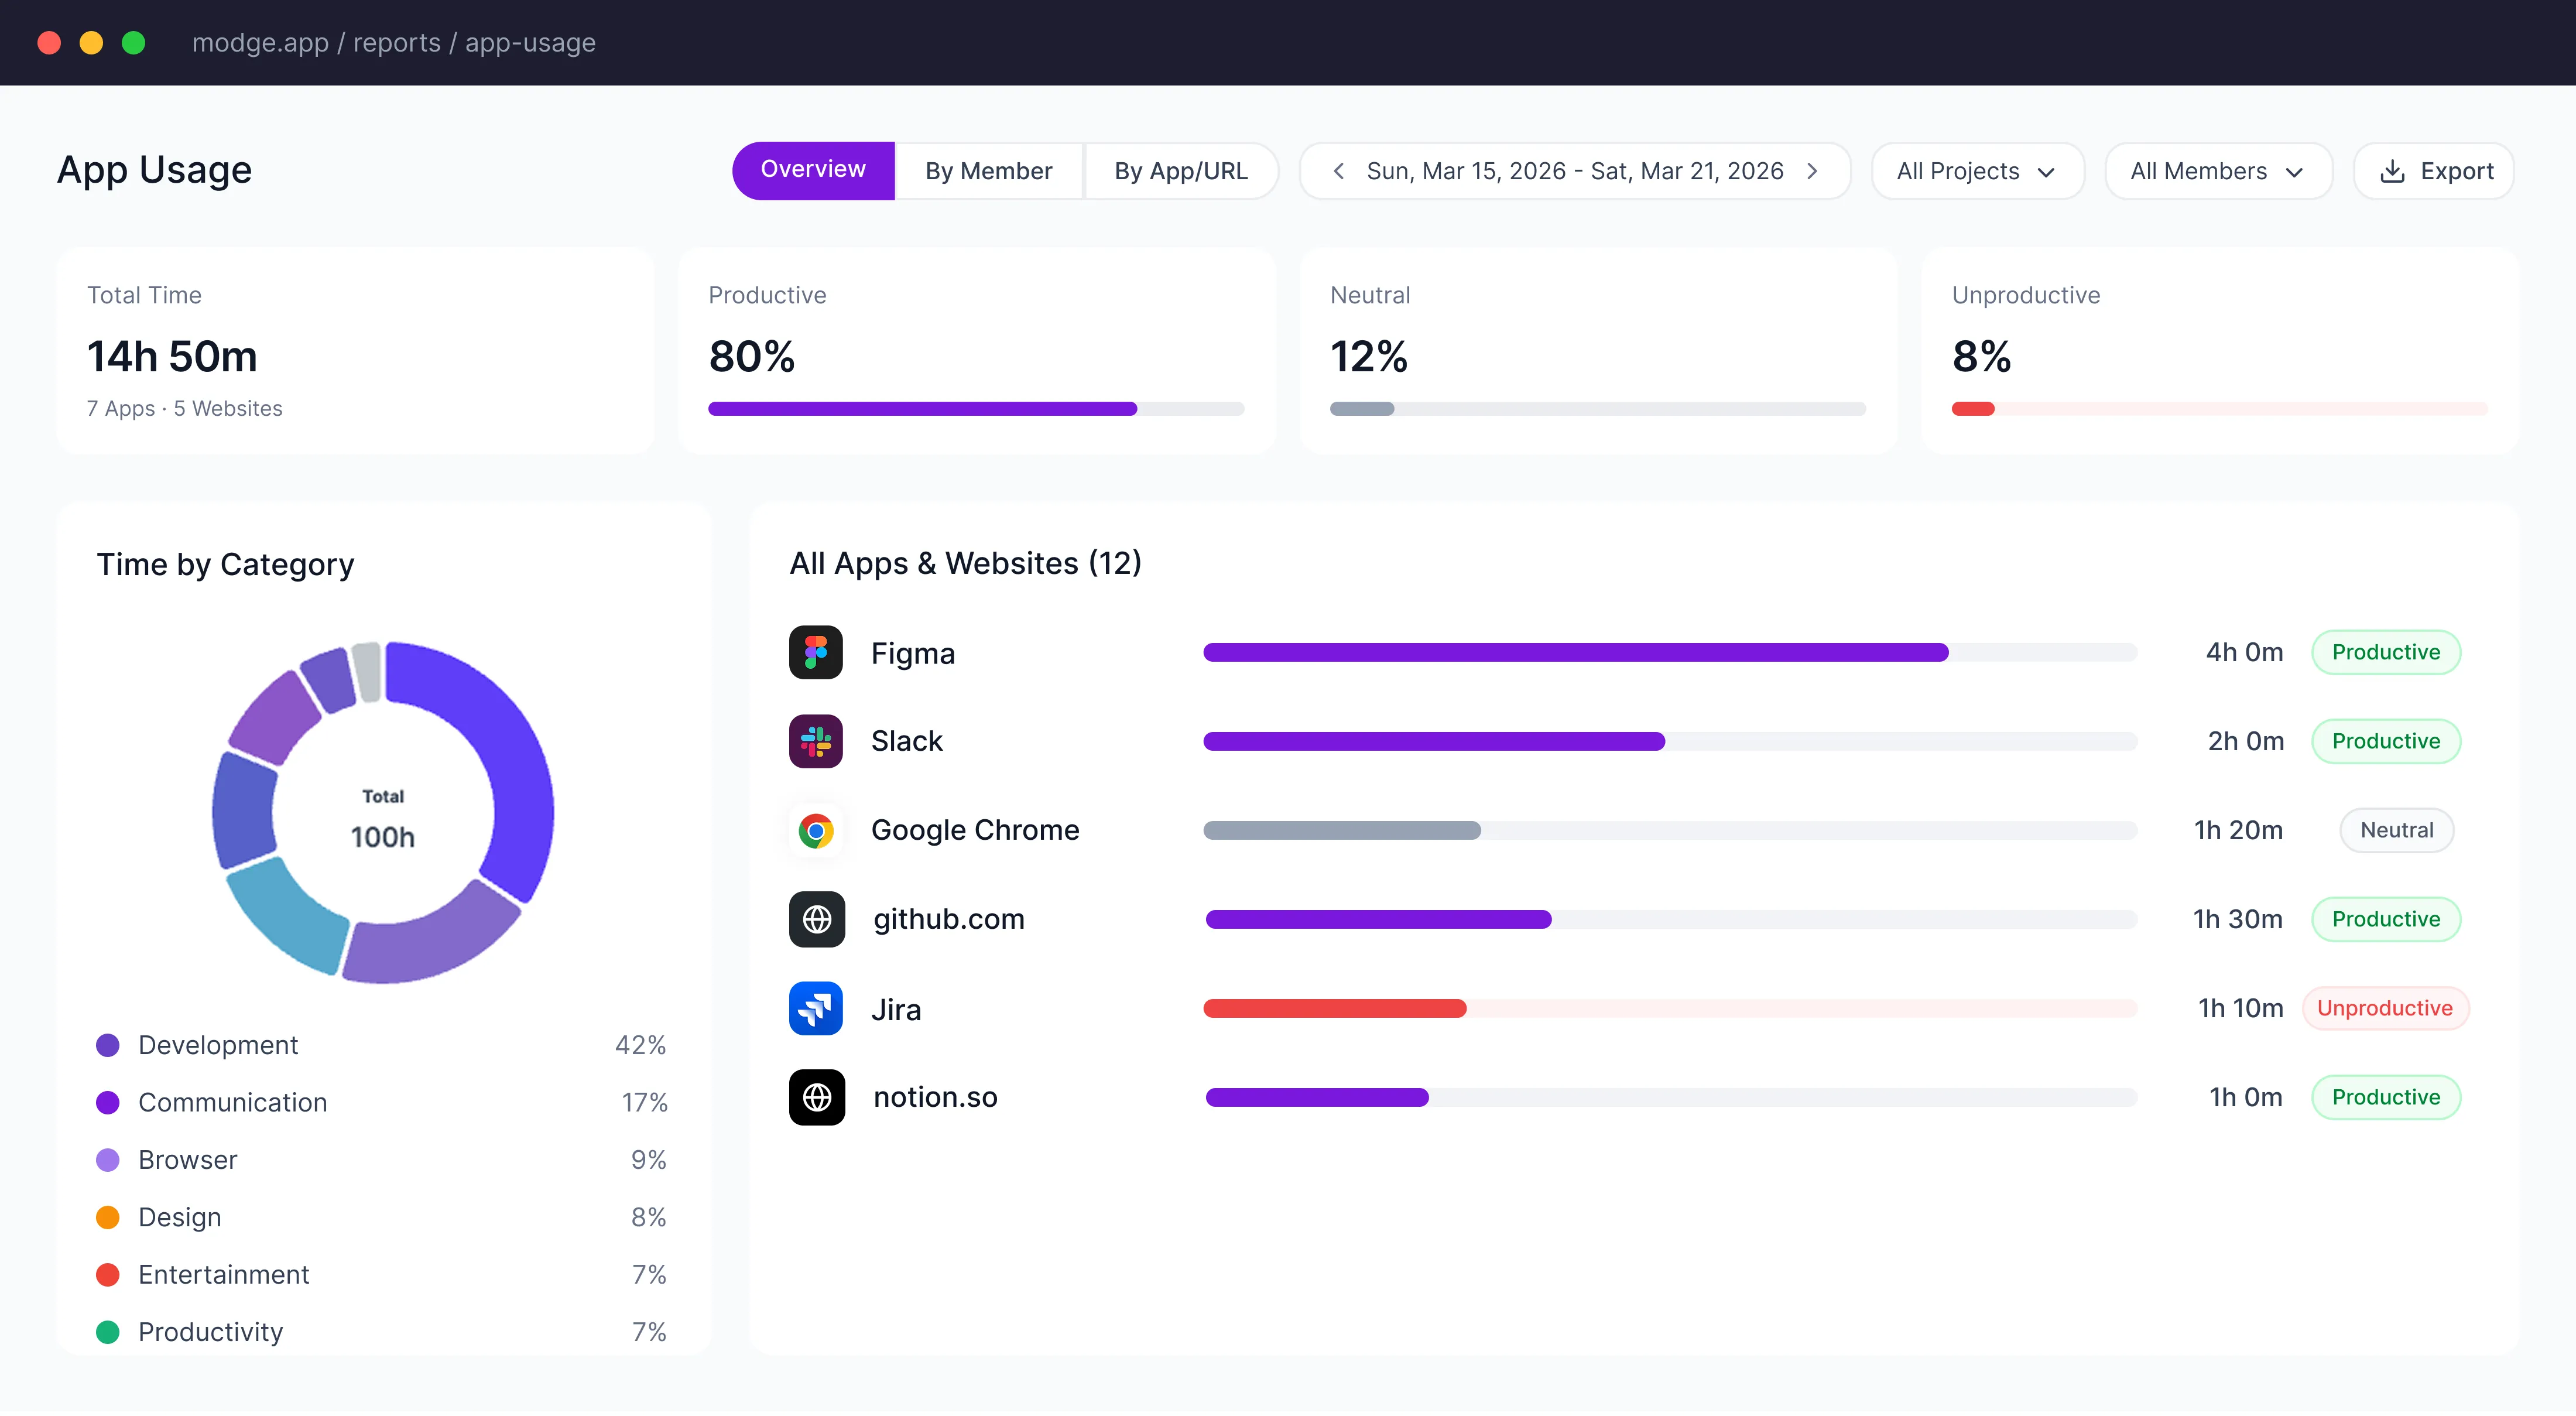
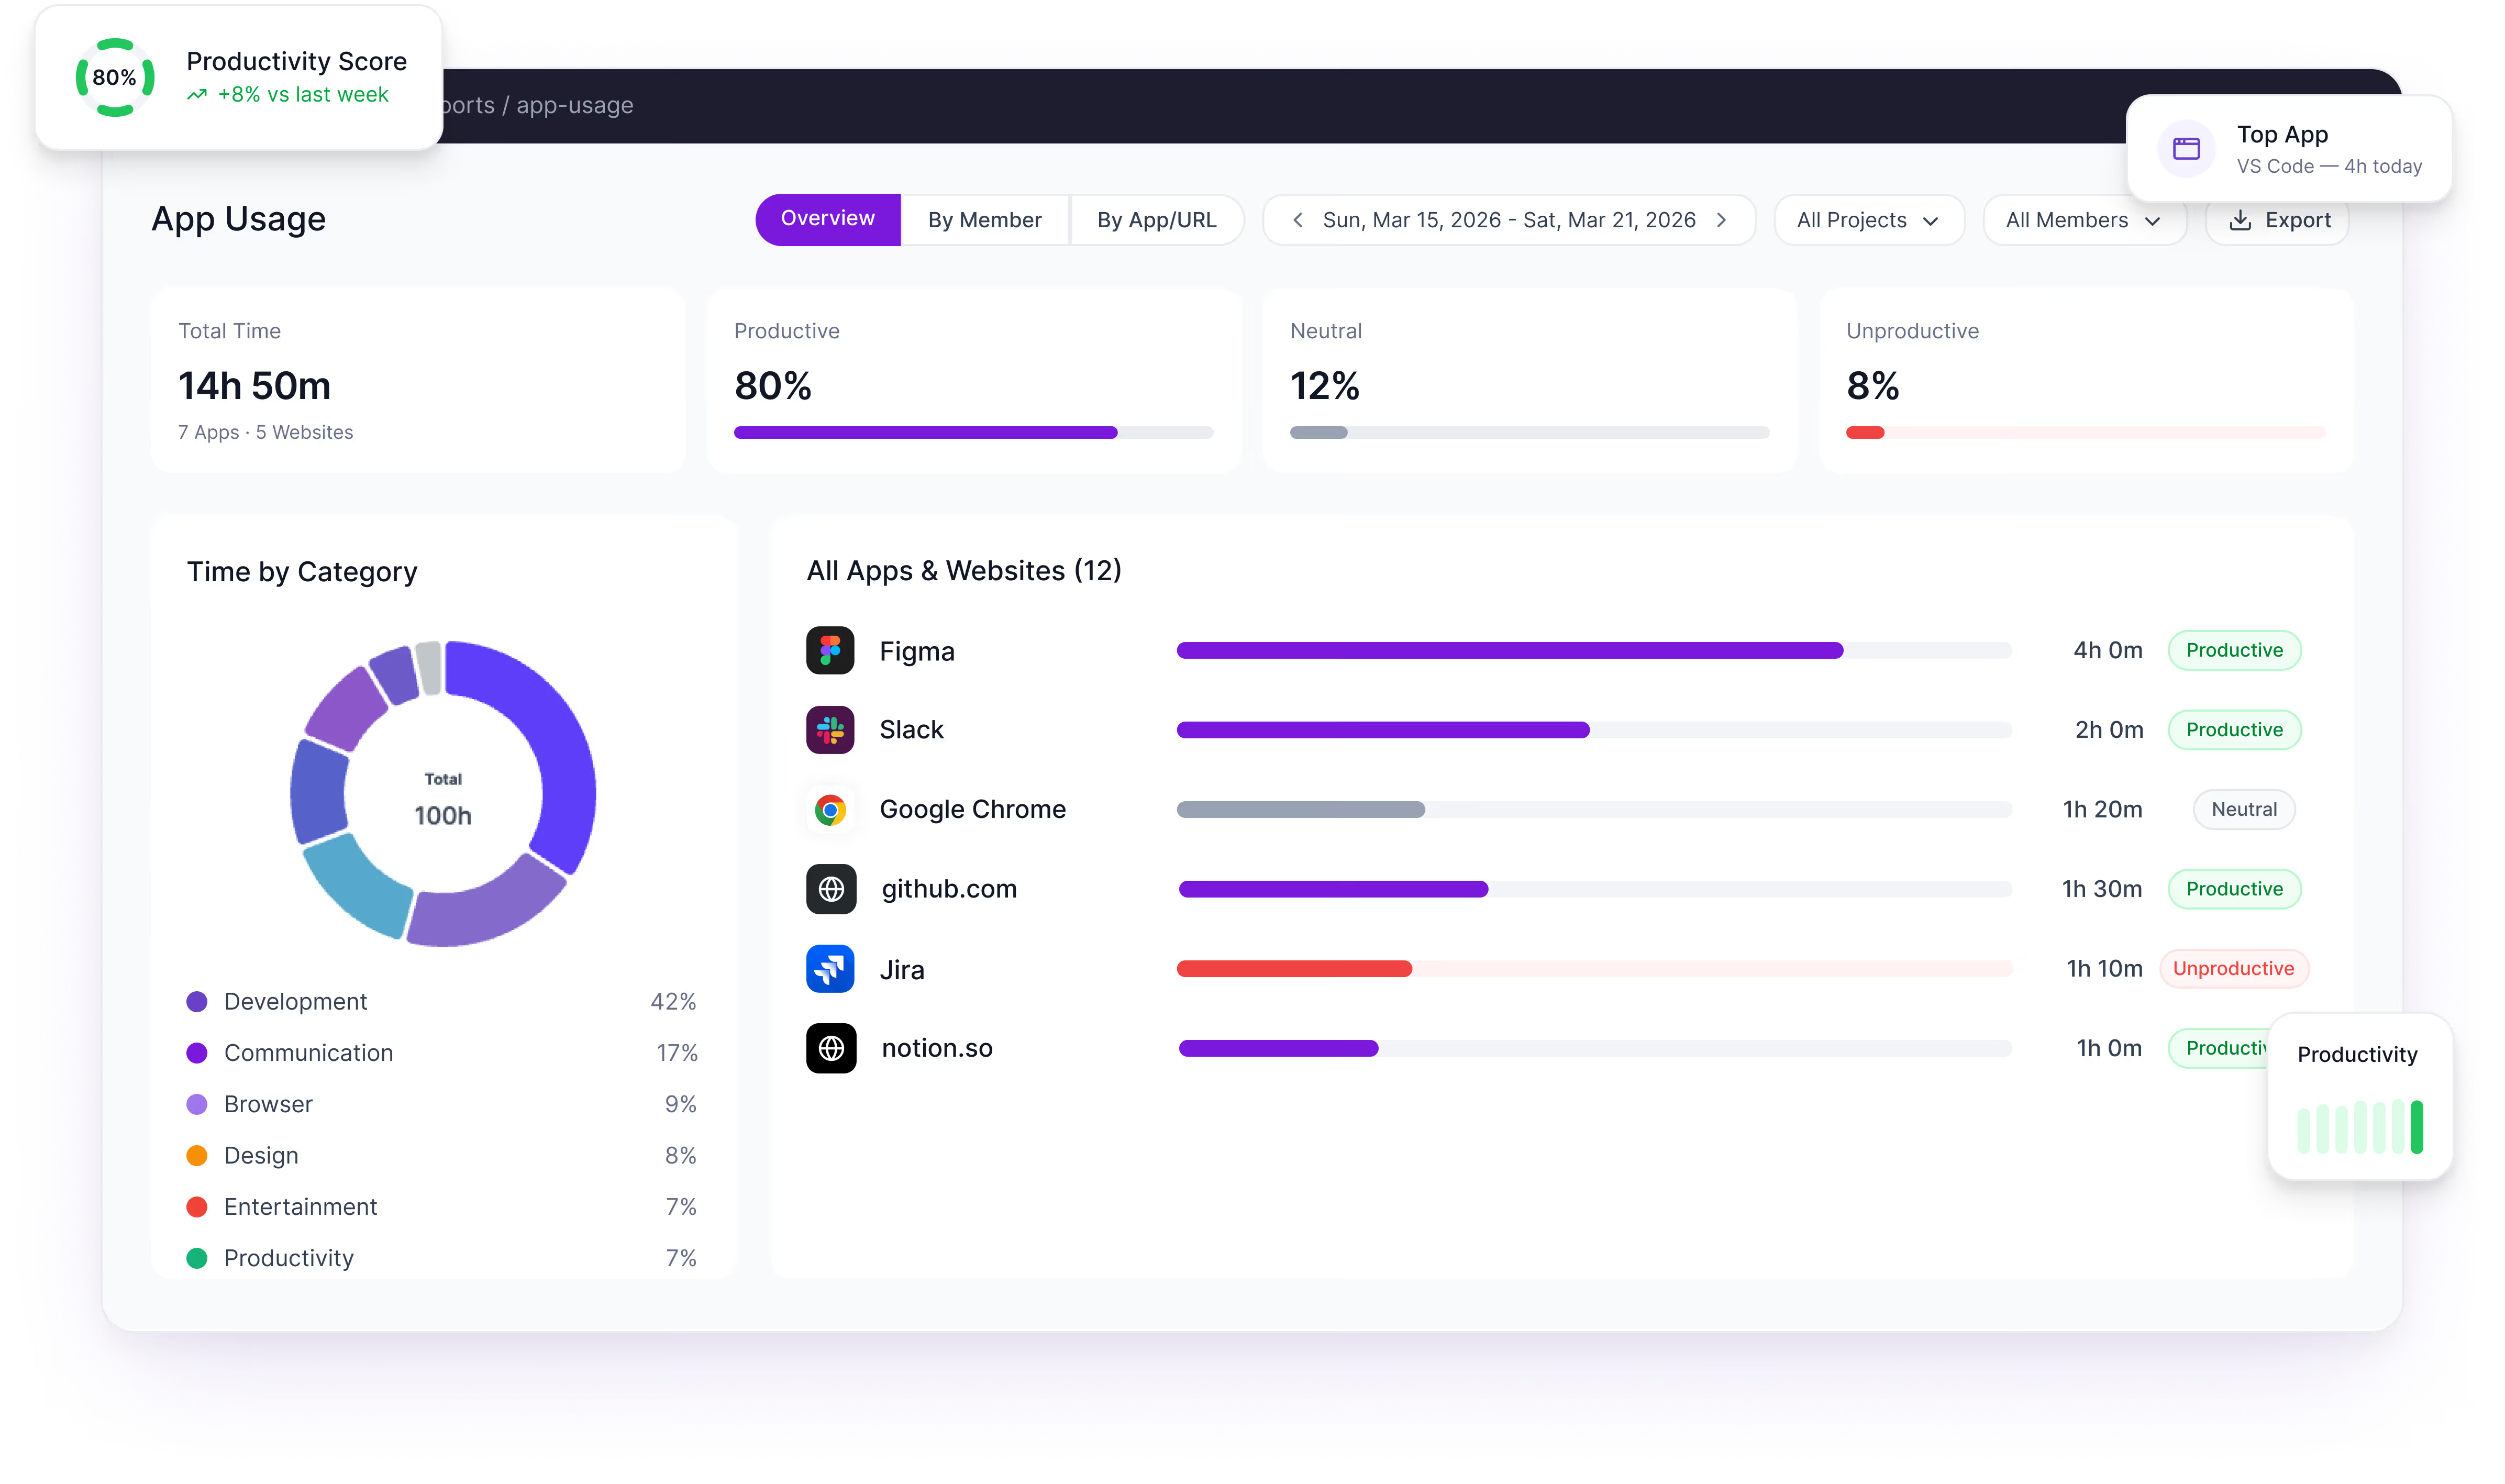
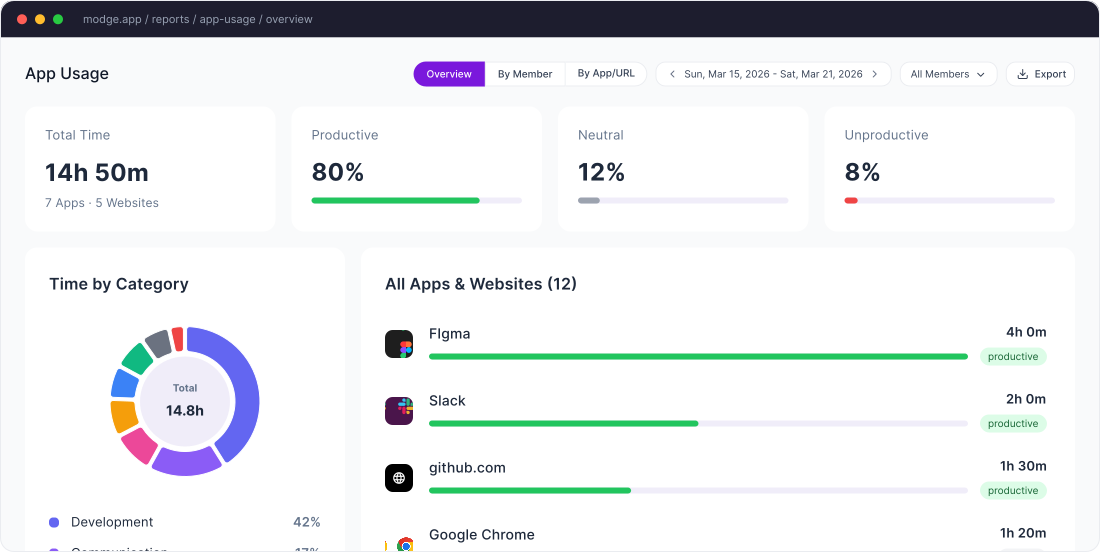
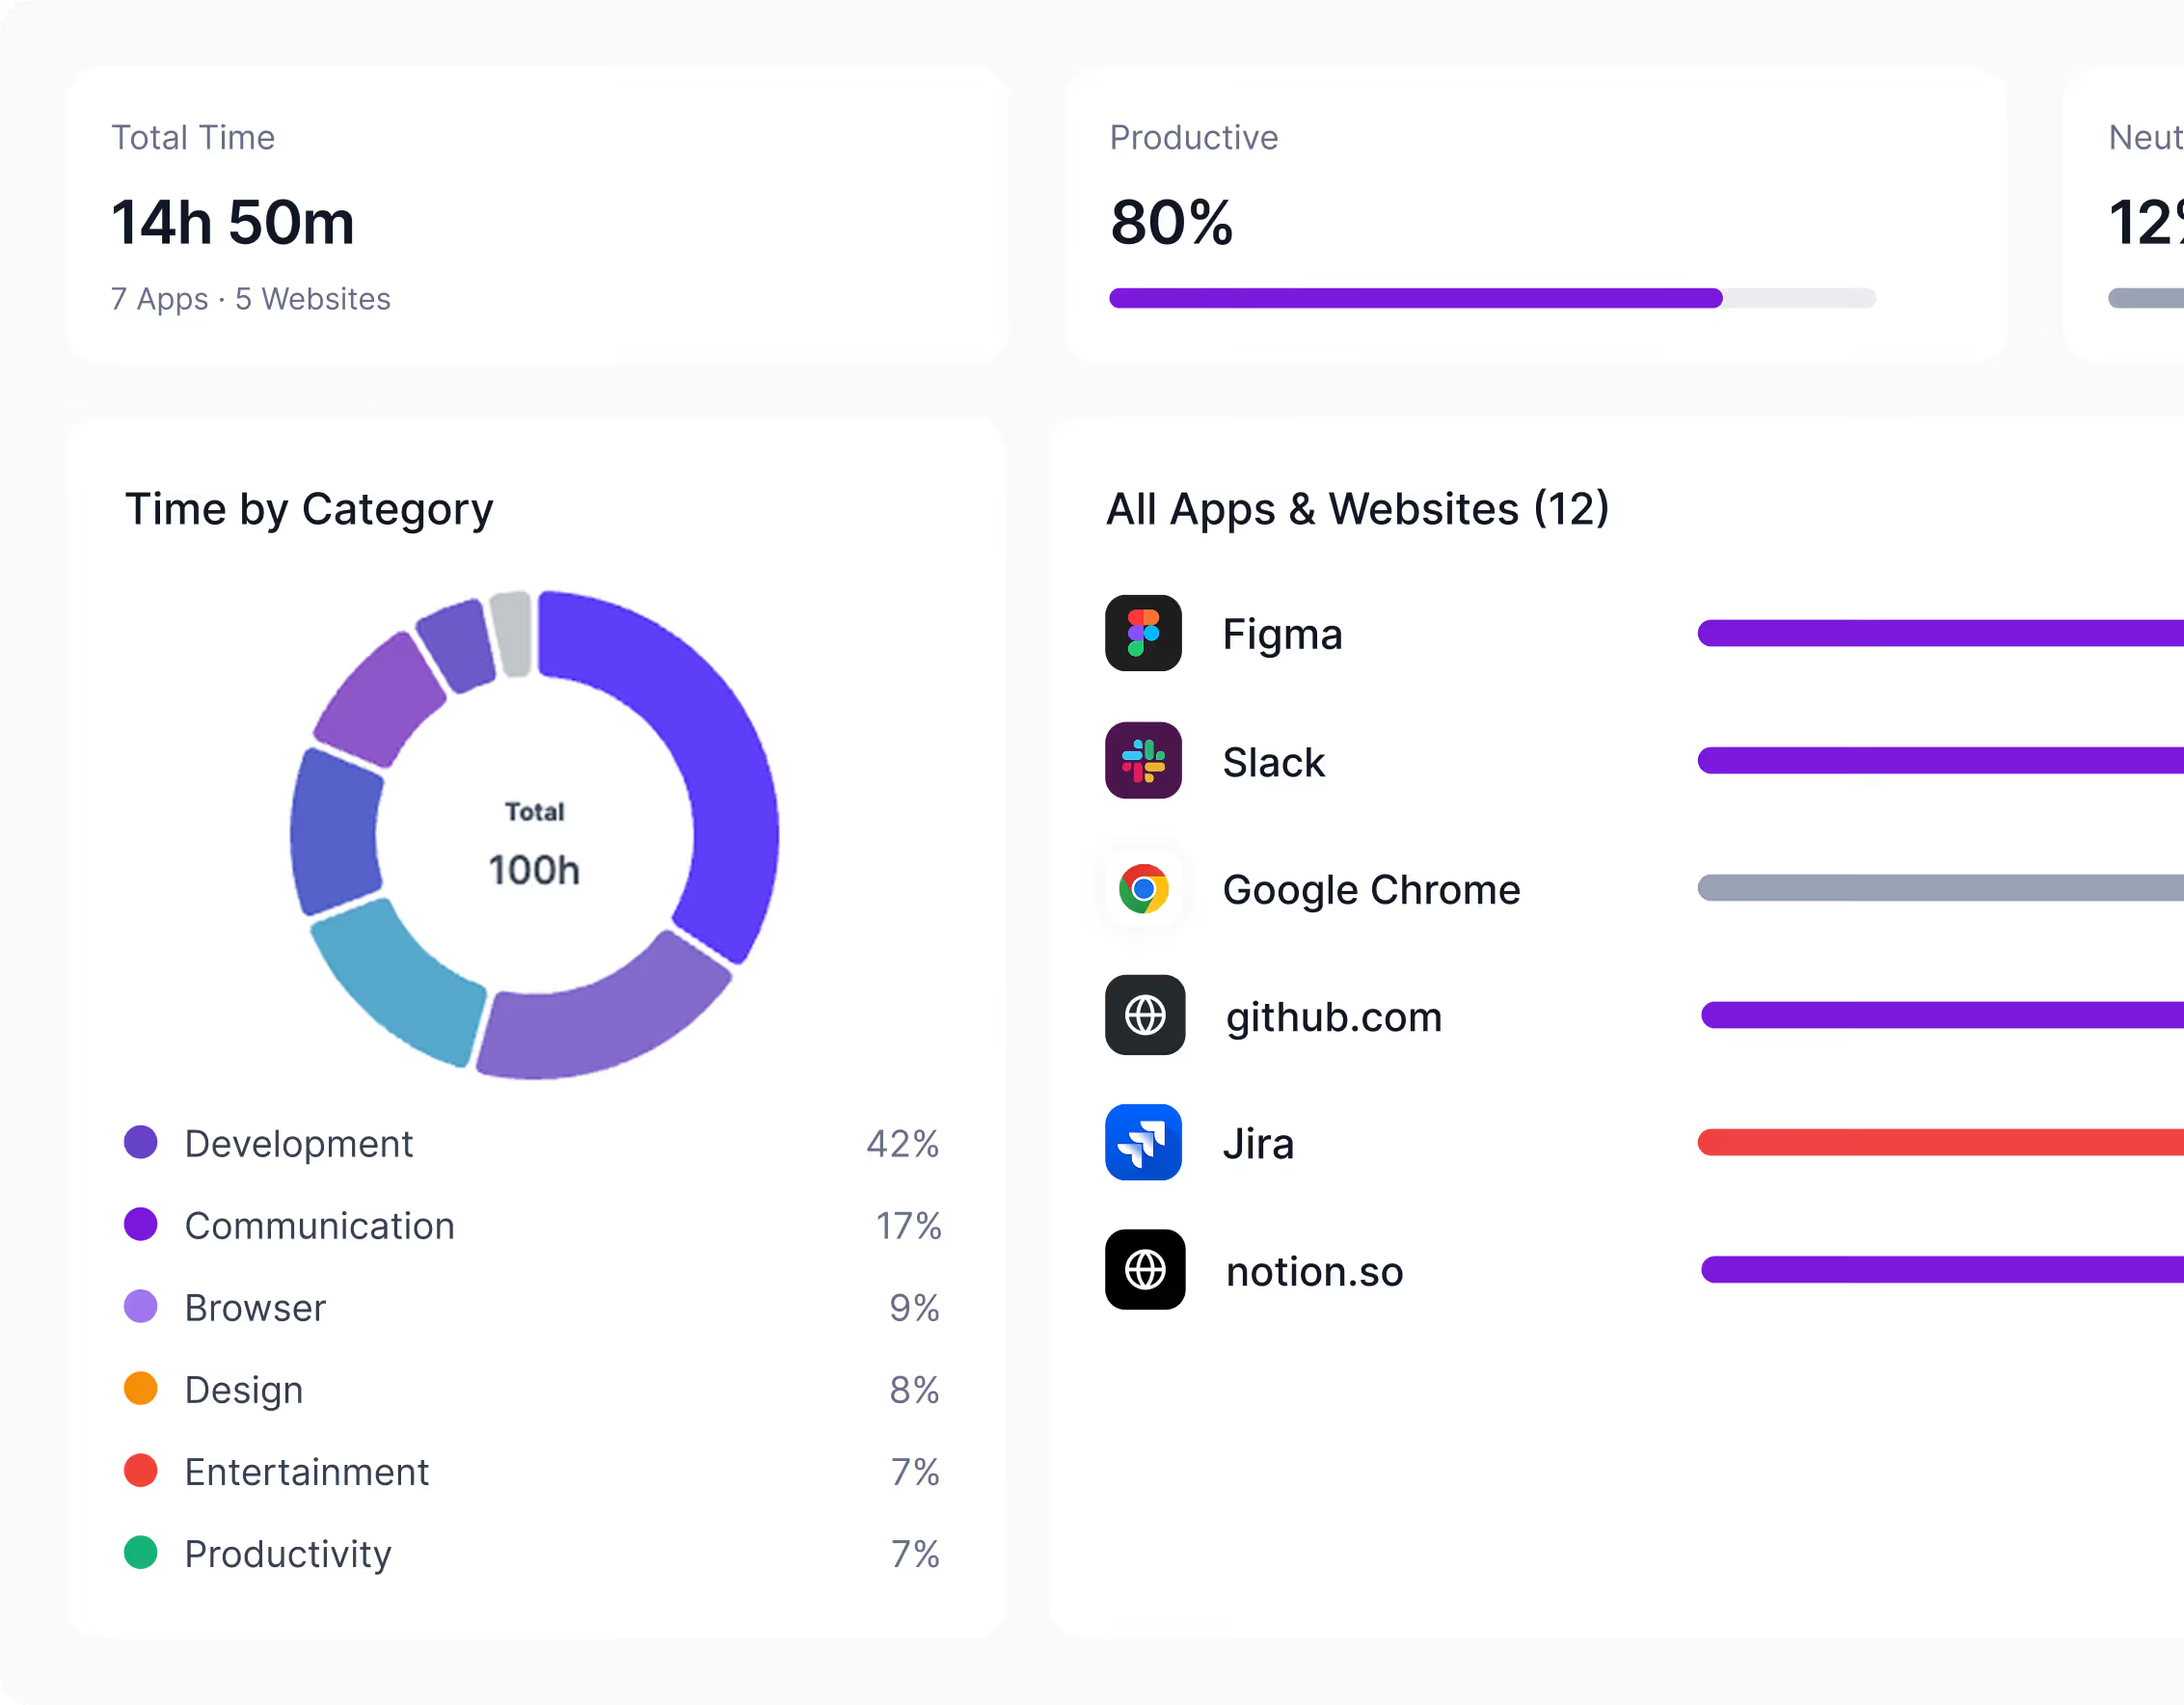
App usage dashboard showing 14h 50m total time across 7 apps and 5 websites with 80% productive, 12% neutral, and 8% unproductive time. Time by category includes 42% development and 17% communication. Usage bars list Figma, Slack, Google Chrome, github.com, Jira, and notion.so with respective usage times and productivity labels.Icon of a browser window next to text reading 'Top App, VS Code — 4h today'.Productivity bar graph with eight vertical bars of increasing height, shaded from light green to dark green.Circular progress indicator showing 80% productivity score with an 8% increase compared to last week.
App usage dashboard showing 14h 50m total time, productivity at 80%, neutral 12%, unproductive 8%, with a donut chart of time by category and a list of apps with usage times and productivity status.
Five circular portraits of diverse professionals arranged in a horizontal row with white borders.
Trusted by 1,800+ remote & on-site teams
0
Apps & URLs Tracked
0
Hours Analyzed
0
Employees Managed
0%
Uptime
THE APP & URL DASHBOARD

See usage by app, by member, or by team.

Three views of the same data. Pick the one that answers the question you're holding.

Top apps and websites, ranked.

See the apps and websites where your team is actually spending time, ranked by hours and grouped by productivity classification. Drill into any app to see who used it, when, and on which projects.

list-icon
Top apps and URLs across any time range
list-icon
Productive / neutral / unproductive split per app
list-icon
Per-user drill-down on every app row
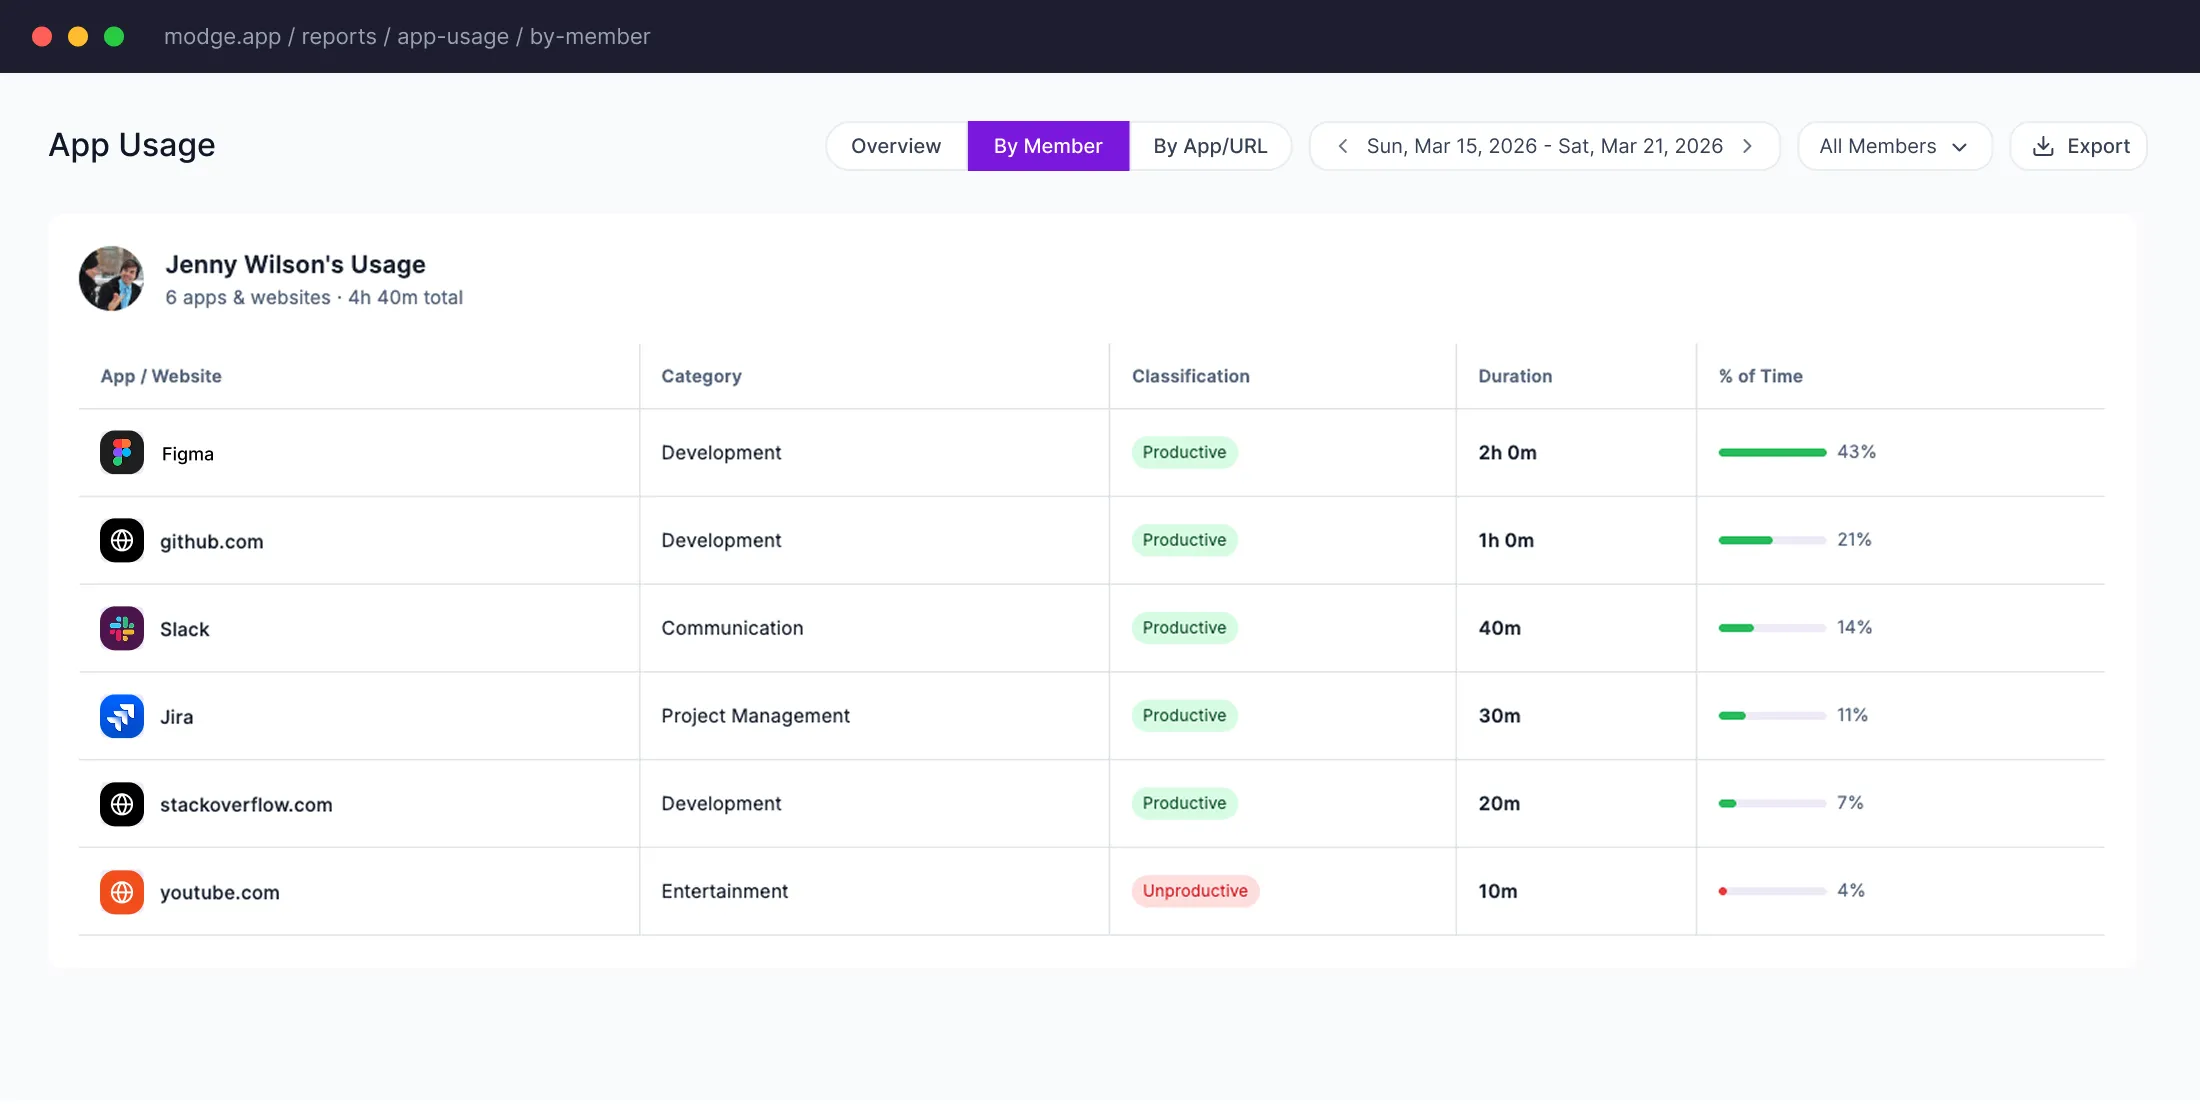
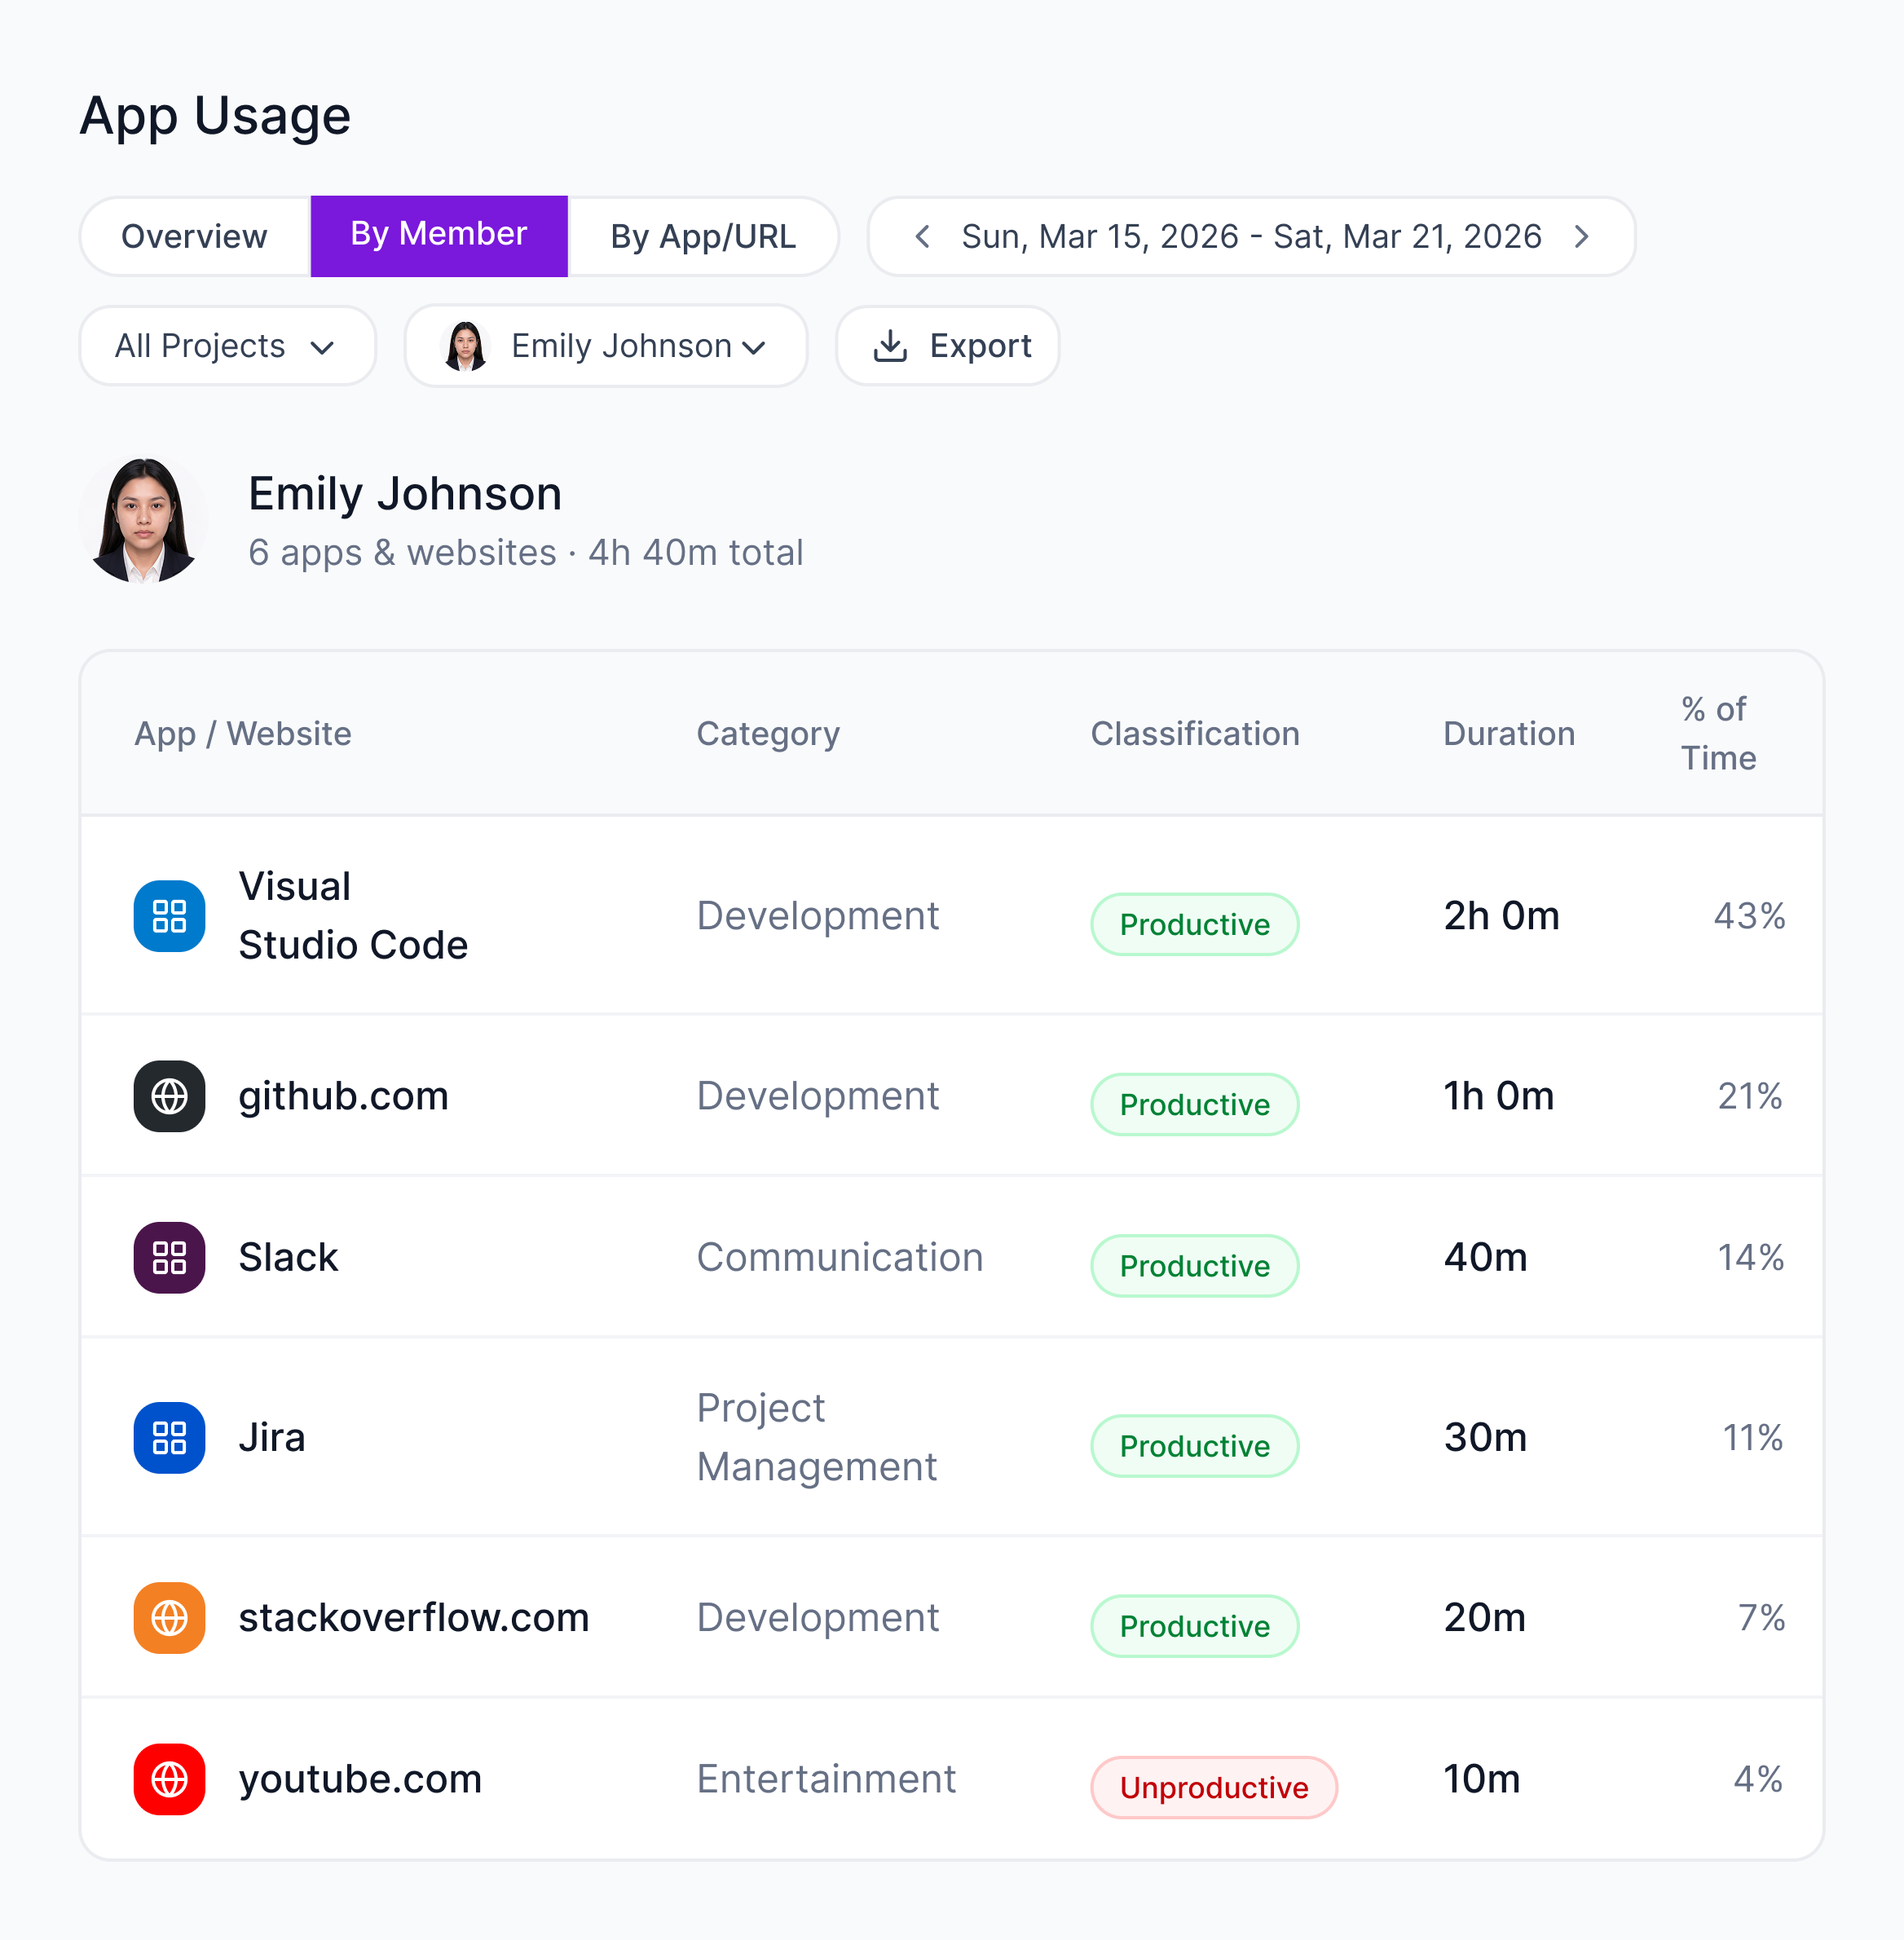
App usage report for Jenny Wilson showing six apps with categories, productivity classification, duration, and percentage of time used between March 15-21, 2026.

Each person's app fingerprint.

Every person, ranked by the apps and URLs that took the most time. The conversation about "what's slowing this person down" finally has data attached.

list-icon
Per-person app and URL totals for any range
list-icon
Productivity score driven by classification rules
list-icon
Idle time excluded so totals reflect actual work

The whole team, side by side.

Compare app usage across teams. Spot patterns: which teams are deep on Figma, which are buried in email, which are switching apps every two minutes.

list-icon
Team-level rollups for any date range
list-icon
Side-by-side comparison across multiple teams
list-icon
Trend deltas vs the previous period
image
WHAT IT IS

Your team's digital work footprint, mapped automatically.

The Modge desktop agent records the active app and the active URL during every tracked session. The list rolls into the dashboard automatically, classified as productive, neutral, or unproductive using a baseline ruleset you can override at the organization level, then again per job title.

No manual tagging. No daily logging form. The data lands in the dashboard the moment a session ends, and the team sees the same view their manager sees, so the conversation moves from "what got done?" to "what should we do next?"

Start Free Trial
Per-Employee Insights

Drill into one person's day.

The By Member view shows exactly which apps and websites each employee used, for how long, and how they were classified. Perfect for 1:1s, performance reviews, and identifying training needs.

list-icon
Per-person ranking of apps and websites by hours
list-icon
Productivity classification at the per-person level
list-icon
Activity timeline color-coded by productive / neutral / unproductive / idle
list-icon
Filter by project, date range, or category
See It in Action
image
image
LIVE

See what's happening right now.

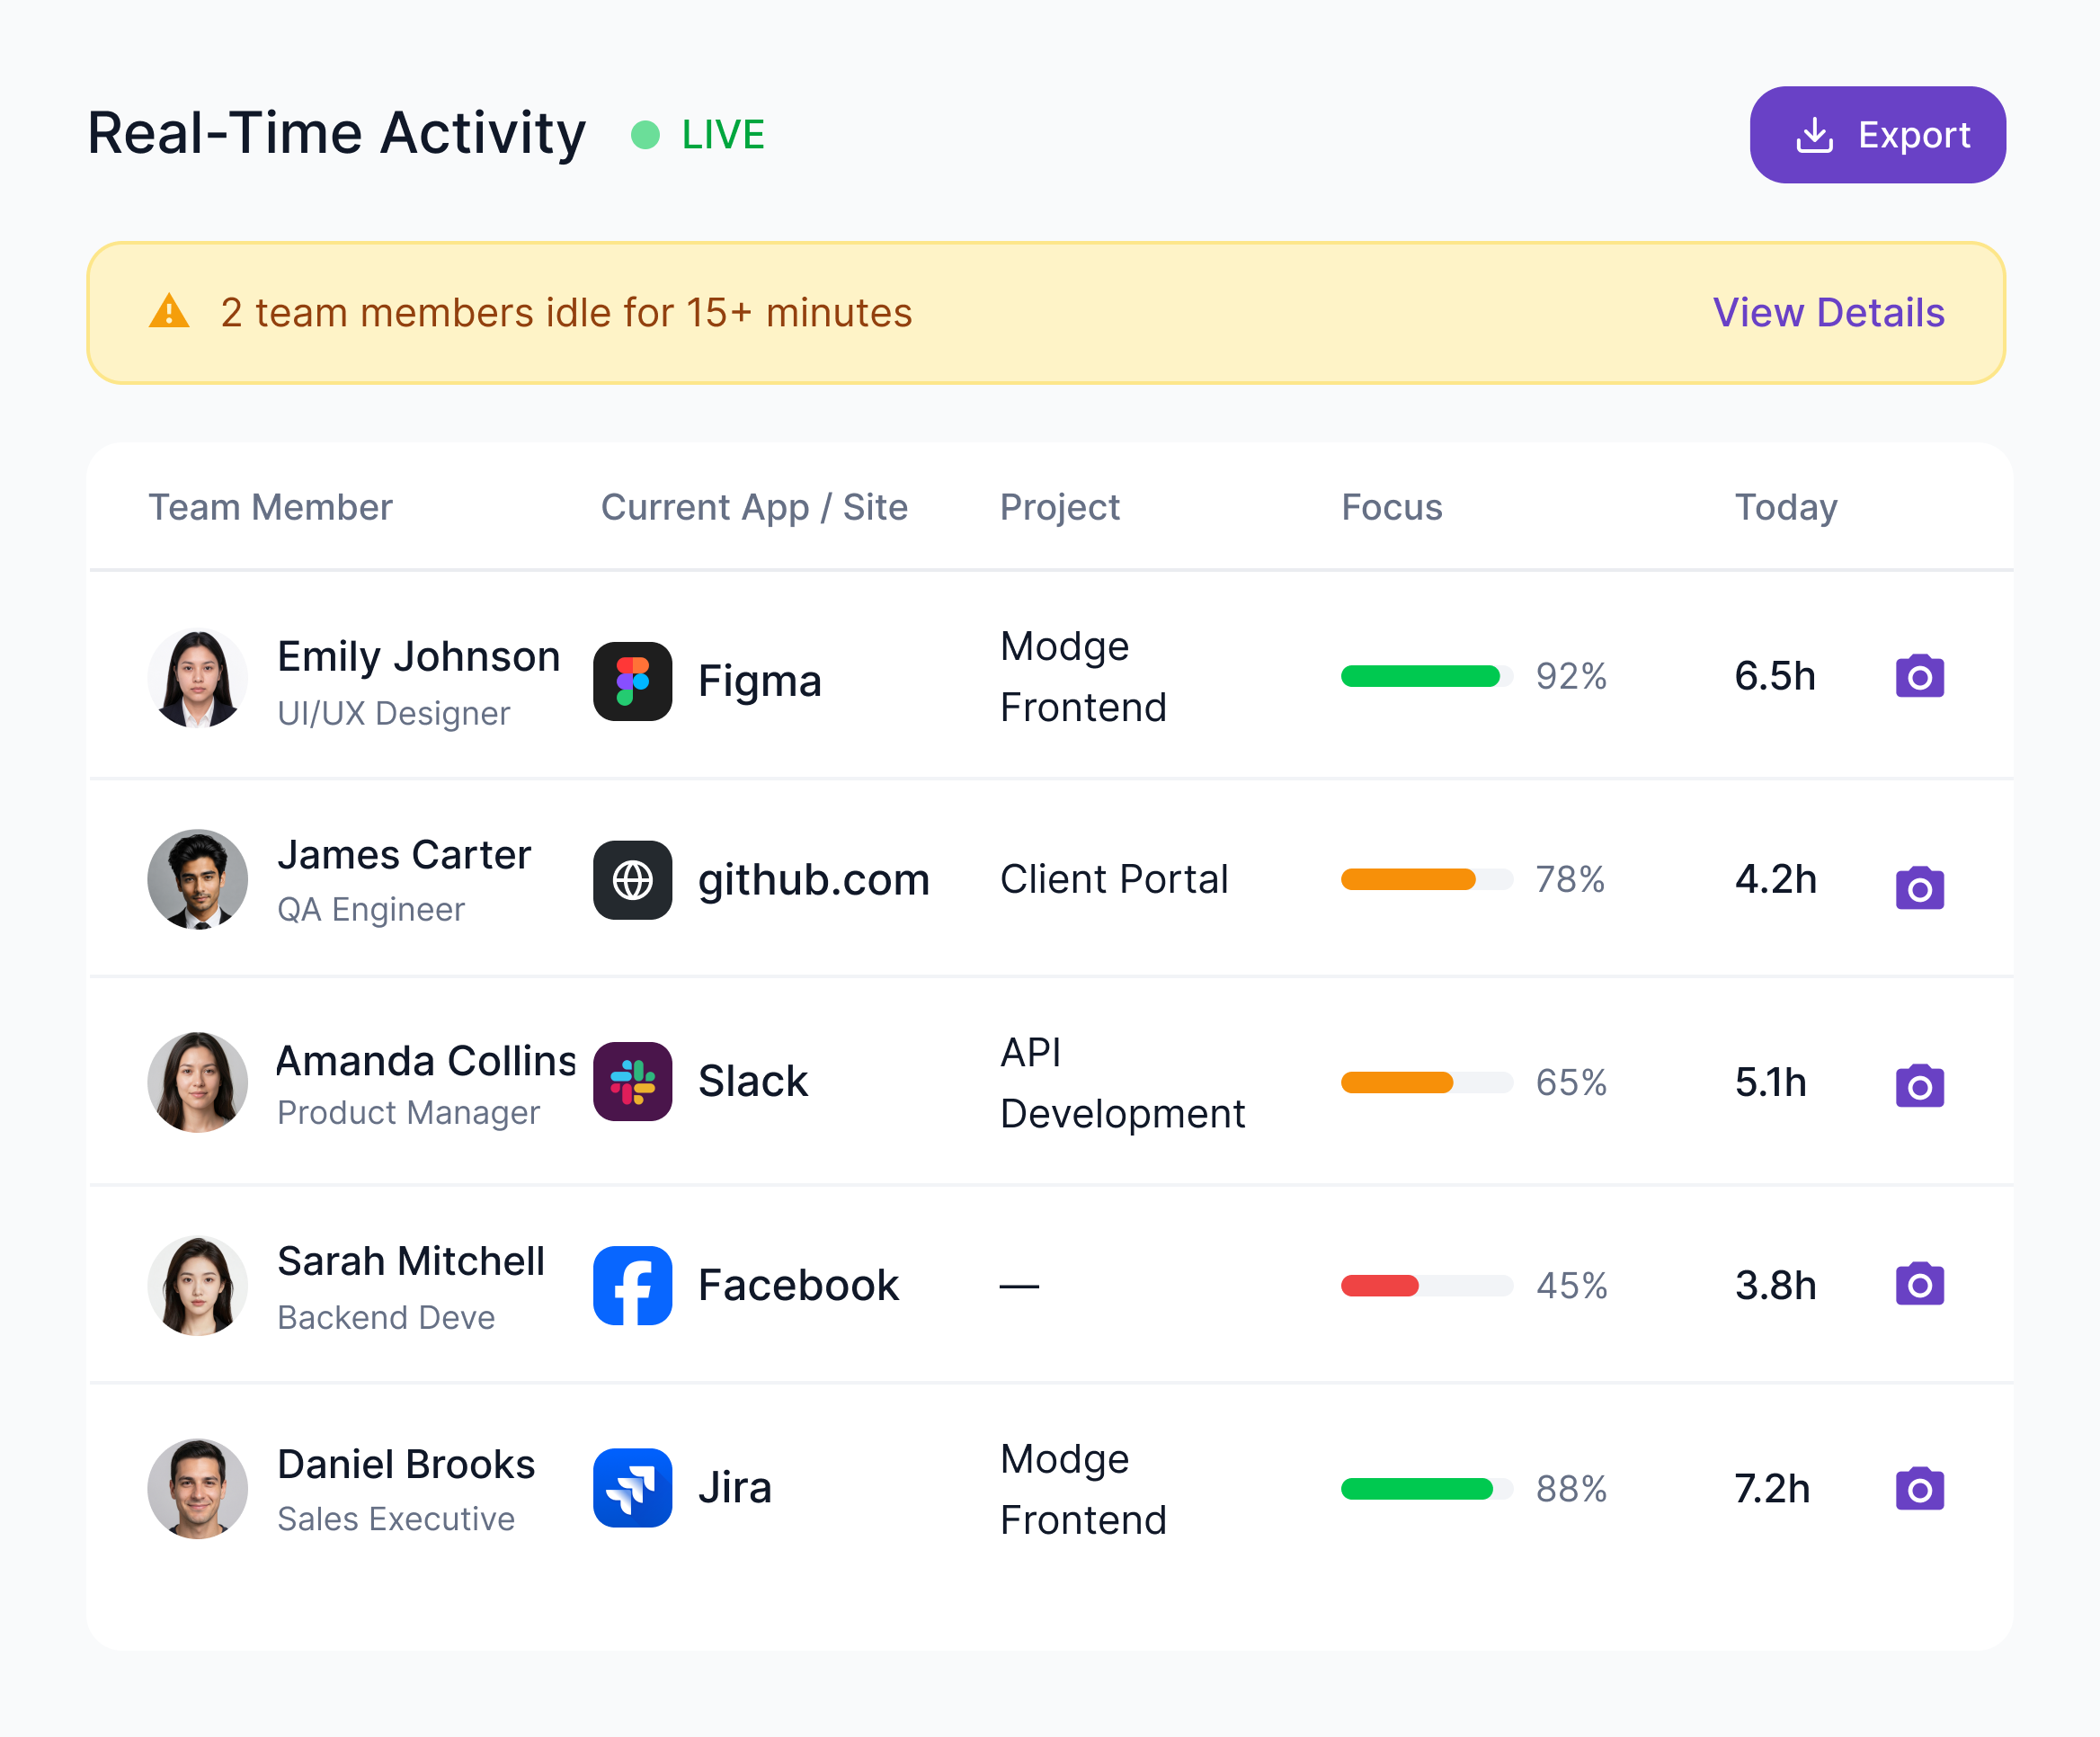
A live view of every team member who's currently working: their project, their active app or website, and the productivity score for the session in progress. Built for managers running distributed teams across time zones.

The feed updates as your team works, not on a polling delay that makes "right now" mean "ten minutes ago."

Start Free Trial
Actionable Insights

Three widgets the manager keeps open in a tab.

Widgets that surface the signal from the noise — at a glance.

Category split
The day broken into productive, neutral, and unproductive percentages - for one person, one team, or the whole company.

Category Split

This week
14.8h
Development 42%
Communication 17%
Design 9%
Productivity 8%
Top apps and sites
The top apps and URLs, ranked by hours, with productivity classification at a glance. Sample row: VS Code 4h, Slack 2h, YouTube 32m.

Top Apps & Sites

Live
VS Code
4h 0m
Slack
2h 0m
github.com
1h 30m
Chrome
1h 20m
Figma
1h 10m
Weekly trend
Productive-time sparkline week over week, with the delta vs the previous period. Good for spotting drift before it becomes a quarterly problem.

Weekly Trend

+8%
Mon
72%
Tue
78%
Wed
75%
Thu
82%
Fri
80%
CORE FEATURES

What you get out of the box.

Automatic & Manual Tracking

One click to start, one click to stop. The agent runs in the background and logs every app, URL, and session without anyone having to remember.

App & URL Tracking

Find the tools your team actually relies on, ranked by hours and grouped by productivity classification, before usage patterns show up in delivery delays.

Idle Detection

Long pauses for thinking shouldn't kill a productivity score. Configurable idle thresholds tell deep focus from real inactivity, so the totals stay honest.

Smart Timesheets & Approvals

Daily and weekly views, in-line edits, and one-click approvals. Friday afternoons get an hour of their life back.

Time Off, Holidays & Breaks

Custom leave policies, PTO accrual, and approval flows that land straight in the right timesheet. No spreadsheet handoff at the end of the month.

Budgets, Rates & Alerts

Set per-project budgets and bill rates, then watch project profitability update as the team logs time, so overruns get spotted before the invoice goes out.

Offline Support

 Network blips don't drop work. Events buffer locally on the device and sync the moment the agent reconnects.

Roles & Permissions

Owner, admin, manager, employee, viewer. Each role sees only the projects, teams, and data their job actually needs.

Exports & Automation

Export CSV or PDF for any date range, person, team, or project. Hand finance and clients clean reports without anyone touching a spreadsheet.

BUILT FOR EVERY ROLE

The right insights for every role.

From team leads to the C-suite, everyone gets actionable usage intelligence.

Team Leads & Managers

See where the team's hours go in real time. Spot the apps that are eating focus before they show up in delivery delays.
list-icon
Reusable shift templates
list-icon
Live adherence tracking
list-icon
Instant missed-shift alerts

HR & Operations

Track adherence to the tools that are part of your work-from-home or hybrid policy. Use category breakdowns to keep training and tooling decisions grounded in data.
list-icon
One-click leave approvals
list-icon
Fast shift reassignment
list-icon
Per-shift adherence reports

Executives & finance

Tie app usage to project profitability. Identify the tools your team actually uses (and pays for) versus the tools they don't.
list-icon
Schedule in any browser
list-icon
Self-serve leave requests
list-icon
Your own adherence score
Proof & ROI

The impact of acting on insight.

23%

More focus time after rebalancing communication tools

5h+

Manager time saved per week chasing "what is the team using?"

2x

Faster procurement decisions on SaaS subscriptions

40%

Fewer underutilized SaaS tools after the first quarter

FREQUENTLY ASKED

Seven things teams ask before turning app and URL tracking on.

How does Modge classify apps and websites?

Modge ships with a baseline classification for common work apps (productive: IDEs, design tools, docs editors; neutral: communication; unproductive: social media, streaming). You can override the classification at the organization level, and again per job title - so the same app can be productive for one role and neutral for another.

Does Modge capture browser URLs?

Yes - per tab, in the major browsers. The dashboard shows which sites actually consumed time during a tracked session, not just which browser was open.

What exactly does the agent capture?

The application name and the active URL during tracked sessions, plus session start, end, and idle gaps. Keystrokes, file contents, and on-screen text are never captured. Screenshots are a separate, optional feature that's off by default.

Can I track app usage outside of work sessions?

No. The agent only captures activity during tracked sessions. When the session ends, capture stops.

Can different roles have different classifications for the same app?

Yes. Override classifications per job title. Figma can be productive for designers, neutral for QA, and unproductive for finance, all without retraining anything.

Can I export app usage data for payroll or finance?

Yes. App usage reports export to CSV or PDF for any date range, person, team, or project. Combine with the time and timesheet exports to build the picture finance needs.

What happens to app and URL data if I cancel?

Your data is exportable any time during the subscription. After cancellation, your account stays read-only for 30 days for export. After that, your data is removed from our systems.

App & URL Tracking

The reports finance always wanted. Without the spreadsheet weekend.

Free for 14 days. Full feature access. Two-minute install on macOS or Windows. Your first set of finance-grade time reports is live in your dashboard before lunch

image