
star-image

4.8 (9,847 Reviews)

Productivity insights that lead to smart decisions.

Modge turns every workday into a real picture: who's working, on what, with how much focus, and where the hours are going. One dashboard for the entire team - across roles, time zones, and projects - with the drill-down detail to act on what you see.

vector

Free 14-day trial

vector

No credit card required

vector

GDPR Compliant

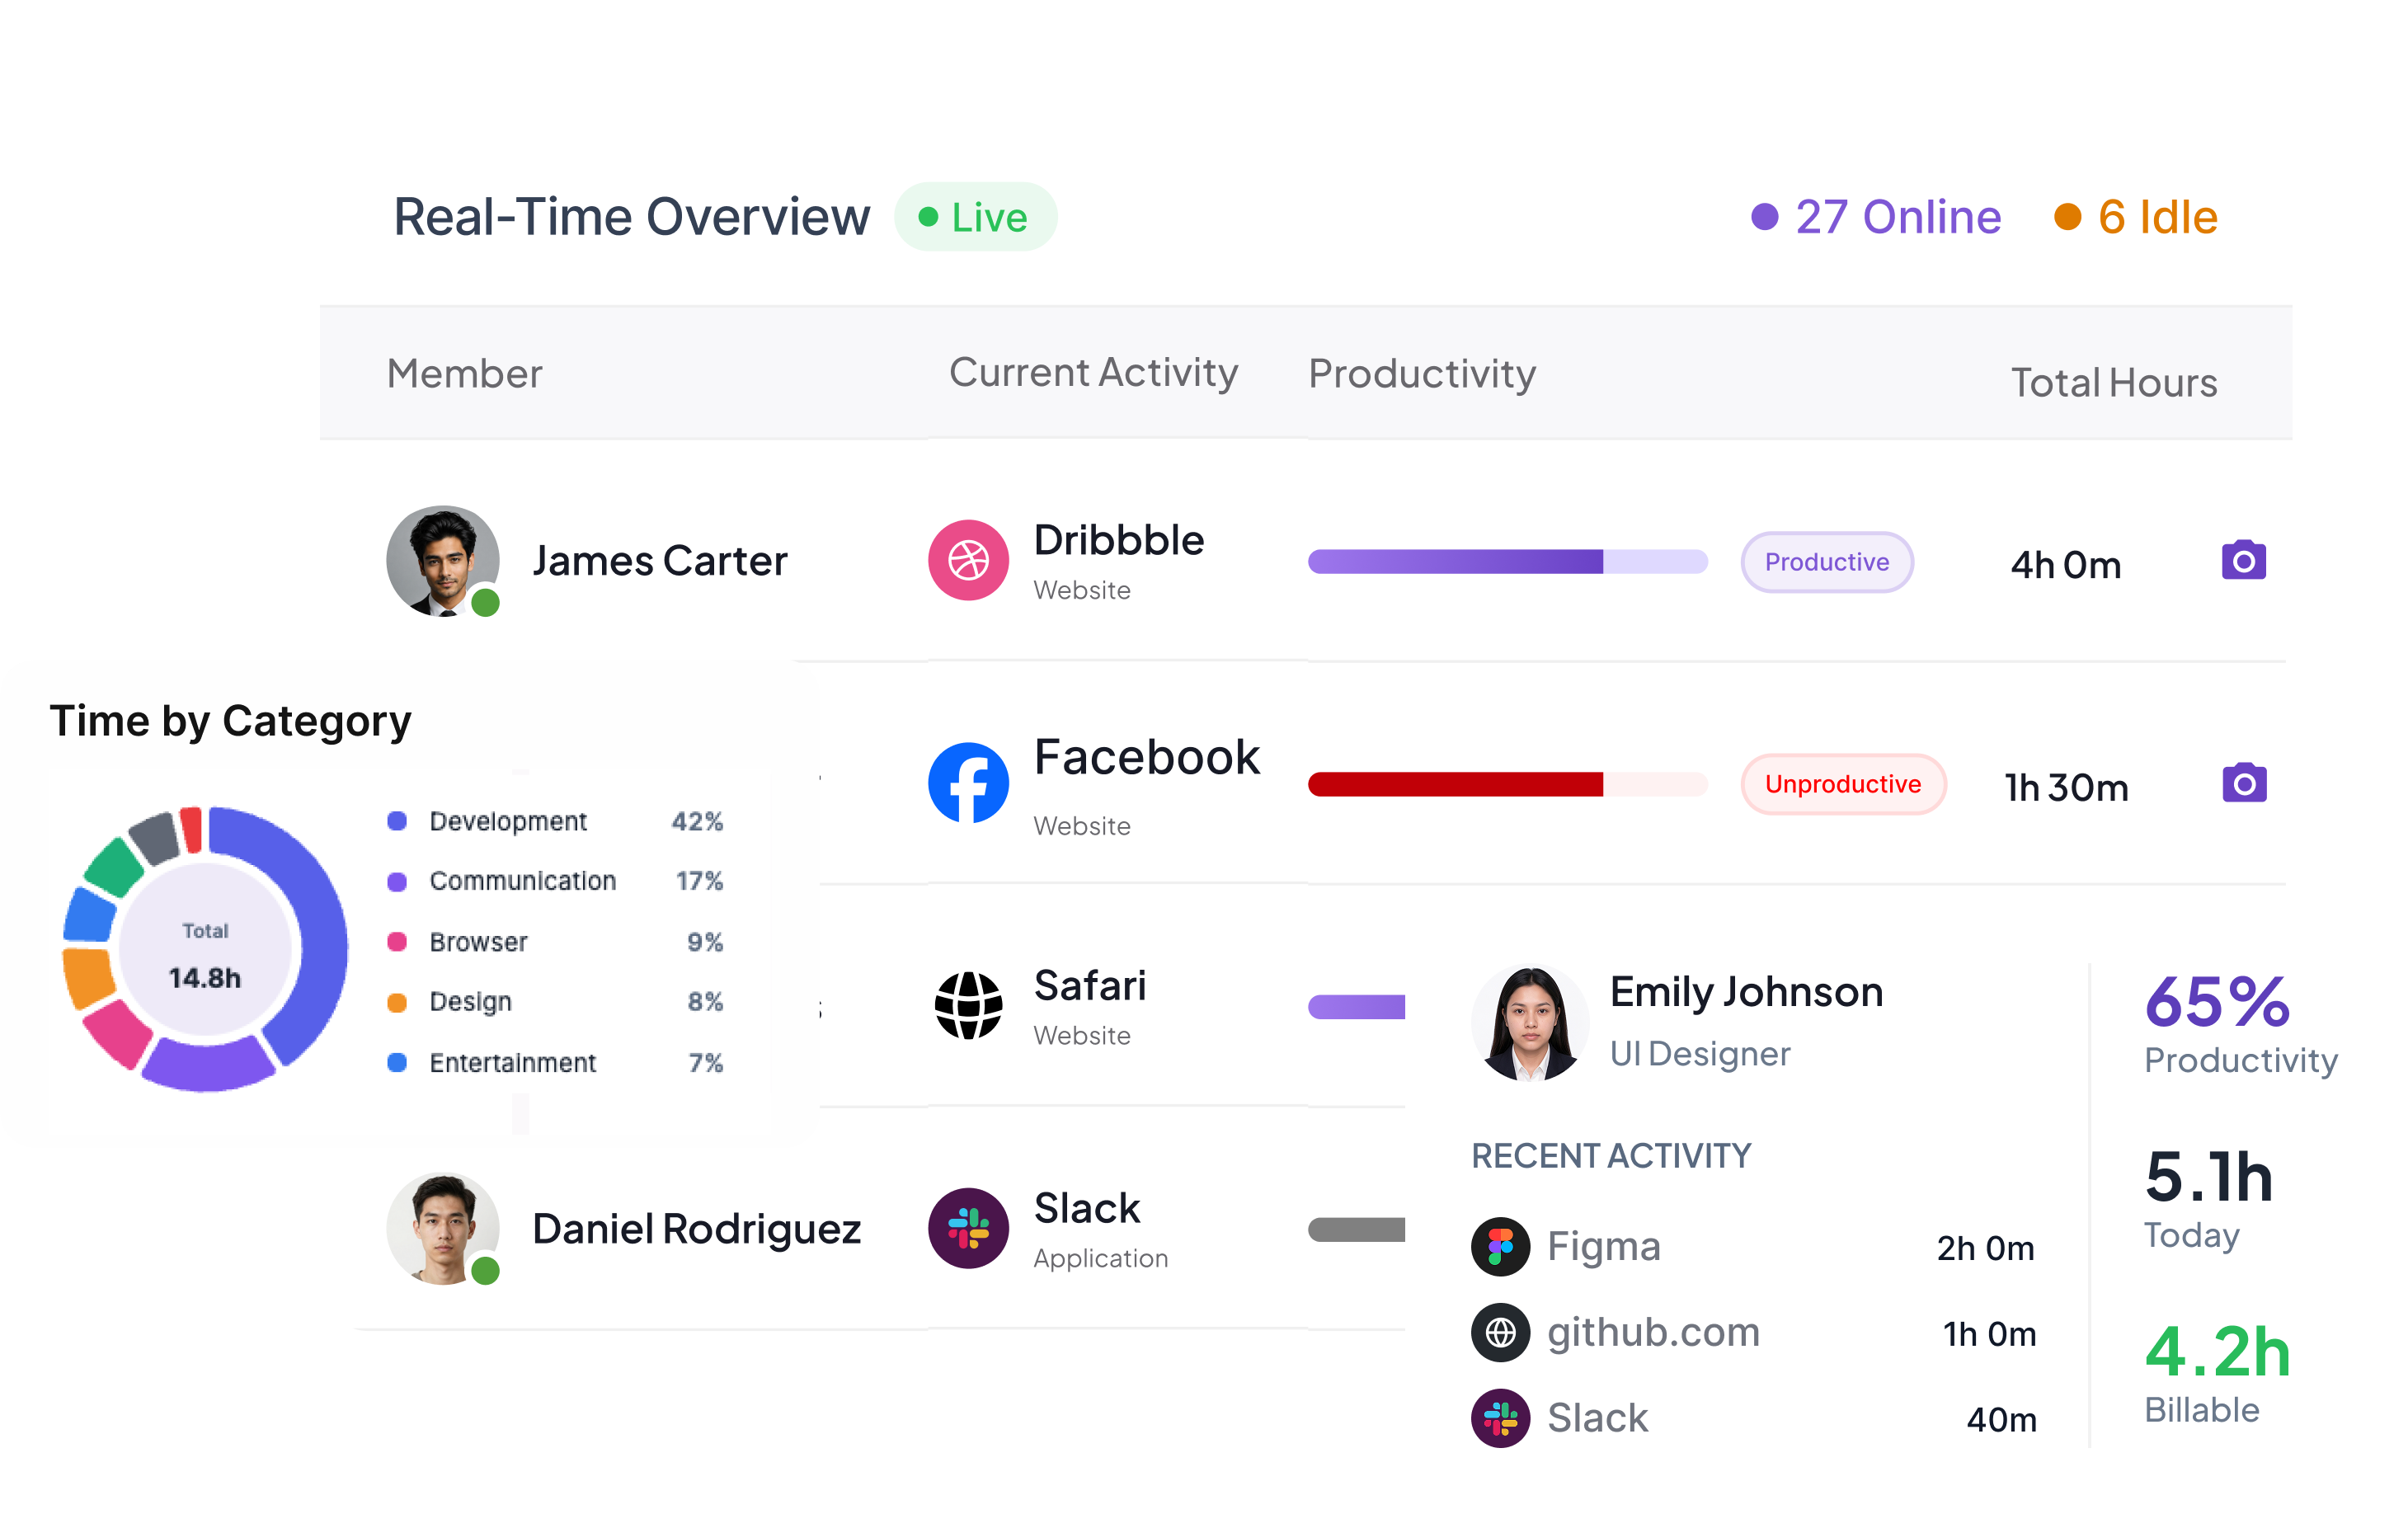
Dashboard showing real-time employee activity with members Brooklyn on Dribbble productive 4 hours, Bessie on Facebook unproductive 1.5 hours, Ralph using Safari productive 48 minutes, and Ralph on Slack neutral 5 hours 20 minutes.Productivity dashboard showing Brooklyn Simmons, UI Designer, with recent activity on Figma for 2 hours, github.com for 1 hour, and Slack for 40 minutes, totaling 5.1 hours today with 65% productivity and 4.2 billable hours.Donut chart titled 'Time by Category' showing total 14.8 hours divided into Development 42%, Communication 17%, Browser 9%, Design 8%, and Entertainment 7%.
Dashboard showing real-time productivity overview with members Brooklyn and Ralph, current activities on websites and applications, a pie chart of time by category, and productivity statistics for Brooklyn Simmons UI Designer.
star-image

4.8 (9,847 Reviews)

Productivity Insights That Drive Real Decisions

One place for productivity scores, time logged, activity timeline, and exportable reports—so you lead with data, not assumptions.

vector

Free 14-day trial

vector

No credit card required

vector

GDPR Compliant

image
image

We've been featured in

THE INSIGHTS DASHBOARD

One dashboard. Smart views. The entire workday.

Pick a view, drill into the detail, then move on with your day.

imageimage
Real-Time

See what's happening right now

A live view of every team member who's currently working: their project, their active app or website, and their productivity score for the session in progress. Built for managers running distributed teams across time zones, not for hovering over the next desk.

Live productivity score for the session in progress

Active app or website with category classification

Filter by team, project, or status (working, idle, offline)

Dashboard

The whole team's day on one screen

Productivity scores, hours logged, active vs idle time, top app categories, leaderboards, shift attendance, and the most recent activity - all on one screen, all updated together when you change the date range.

Day, week, or month views with a single date-range picker

Scoreboards per person, per team, and per project

Trend deltas against the previous period so you know if things are improving

imageimage
imageimage
App & Usage Reports

Where the hours are actually going

Every app and website your team uses, ranked by hours and grouped by productivity classification. Drill into any app to see who used it, when, and on which projects. The conversation about "what's slowing us down" finally has data behind it.

Top apps and websites for any time range

Per-person and per-team breakdowns

Productive, neutral, and unproductive splits at a glance

Screenshots

Verifiable when needed. Private when not.

Optional screenshot capture with configurable intervals and configurable blur. Off by default, on for the teams or people who need it, blurred for privacy when policy demands it. Clients get proof of work without your team feeling watched.

Per-team and per-person on/off control

Capture interval set to match your policy

Blur toggled at the organization level or per individual

imageimage
image
Timeline

Every workday, color-coded

Stop guessing where the day went. Each person's workday renders as colored blocks, productive, neutral, unproductive, and idle, with the app, the duration, and the project one hover away. The whole story of the day lives in a single scroll.

Productive / neutral / unproductive / idle color blocks

Hover for app & url, project, and duration

Compare timelines across team members on the same day

How It Works

Step 1

Capture activity automatically

The Modge desktop agent installs in about two minutes on macOS or Windows. From the first session onward it captures time, apps, websites, and (only if you choose) screenshots. No timer to start, no daily logging form to fill in.

image
Step 2

Classify and score the work

Apps and websites are classified the moment they show up - productive, neutral, or unproductive - using rules you can override per organization or per job title. Activity rolls into a productivity score. The dashboard updates as the day happens.

image
Step 3

Act on what the data shows

The dashboard surfaces the signals worth acting on: idle streaks, missed shifts, unprofitable projects, burnout patterns. Most teams have their first "we need to fix this" conversation inside the first week.

image
Step 1

Capture Activity

Apps, websites, activity levels, idle time, and attendance are logged automatically during work sessions.

Time spent on apps: Figma 2 hours 34 minutes, Slack 1 hour 12 minutes, Chrome 45 minutes, Visual Studio Code 45 minutes, with live tracking indicator.
Step 2

Analyze

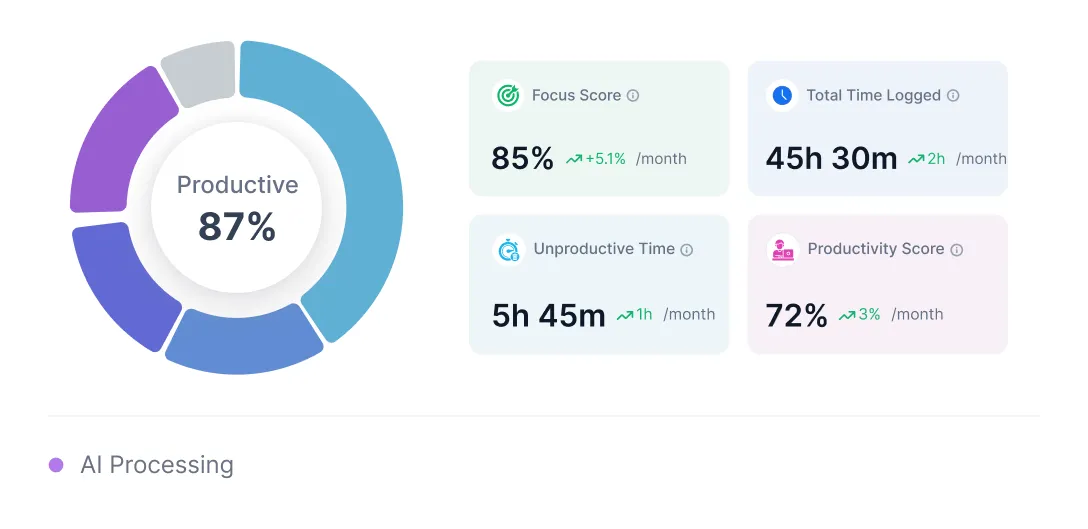
Al groups captured data into focus trends, productivity labels, idle ratios, and team comparisons

Productivity dashboard showing 87% productive time with focus score at 85%, total time logged 45h 30m, unproductive time 5h 45m, and productivity score 72%.
Step 3

Act

The Insights Dashboard flags risks and suggests data-driven fixes to optimize schedules and performance.

Dashboard interface showing productivity metrics including focus score, total time logged, active time, idle time, productivity trends bar chart, top categories pie chart, hours tracked line graph, and a late and missed shifts table.
WHY IT MATTERS

Lead With Data, Not Assumptions

What changes the moment your decisions stop being best-guesses.

1

Without the right tools

Productivity is "vibes" - you only know who's struggling once they say so

Time tracking lives in three tools and four spreadsheets

Schedule adherence is a Slack DM and a screenshot

2

With Modge

Productivity is a number per person, per team, per project

Tracked time, attendance, and timesheets share one source of truth

Adherence is scored automatically against the schedule you already set

INTELLIGENCE

Insights that read the work, not the worker

 Six pattern-detectors that turn raw tracking into things a manager can actually act on.

Productivity classification

Every app and website is classified as productive, neutral, or unproductive - using rules you can override per organization or per job title. Figma is productive for designers, neutral for QA, your call.

Idle and break detection

Review hours that actually happened. Sessions that go quiet past your configured threshold are flagged as idle, so tracked totals reflect real work, not abandoned screens.

Focus and context-switching signals

Get a real answer to "why is shipping slow?". Long uninterrupted focus blocks earn a higher score, constant app-switching shows up as a flag, and the conversation finally has data behind it instead of vibes.

Suspicious activity flags

 Mouse-jiggler patterns. Scripted clicks. Login hours that don't match anyone's calendar. The patterns that don't add up get surfaced before they show up on an invoice.

Workload and burnout signals

Spot the burnout before it turns into a resignation. Long streaks without breaks, weeks without leave, and sustained productivity no human can hold forever all surface as early signals you can act on.

Recommendations (roadmap)

Know which fire to put out first. AI-generated recommendations are on the way, which projects to rebalance, who's about to burn out, which clients are losing money. Available to early-access customers later this year.

BUILT FOR PERFORMANCE TEAMS

Built for every team that values performance.

 From distributed startups to global enterprises, Modge adapts to any workflow and delivers real-time proof of productivity.

image

Remote & Hybrid Teams

Real visibility across time zones without status-update theater. Async by design.

image

Agencies & BPOs

Profit-per-retainer reports, billable proof for clients, and per-team policies for in-house and offshore.

image

Tech & SaaS

 Protect engineering focus, surface context-switching, and keep delivery cycles honest.

image

Operations & HR

 Attendance, adherence, leave, and payroll on one source of truth.

image

Enterprise

Multi-team, multi-manager, role-scoped from the database up. Centralized governance with the report fidelity boards expect.

IMPACT

What changes once teams switch to Modge.

Real results from teams who use Modge AI to optimize productivity.

23%

in 30 days

More focus time in the first 30 days

5h+

per week

Manager time saved per week on timesheet chasing

faster approvals

Faster reporting and approval cycles

40%

fewer status meetings

Fewer status meetings on average

FAQ

Common Questions

What does Modge actually count as "productive"?

By default, Modge ships with a baseline classification for common work apps (productive: IDEs, design tools, docs editors; neutral: communication tools; unproductive: social media, streaming). You can override the classification at the organization level, then again per job title - so the same app can be productive for one role and neutral for another.

Does the productivity score change in real time?

Yes. The session-level score updates as your team works. Daily, weekly, and monthly aggregate scores update once each session ends.

Can my team see their own productivity score?

Yes. Employees have access to their own dashboard with the same scores their manager sees. We've found that visibility for the person doing the work drives more behavior change than visibility for the manager alone.

Does Modge work offline?

The desktop agent continues capturing time and activity when offline. Sessions sync to the dashboard the next time the agent has internet - no data loss, no missed entries.

Is this surveillance software?

No. Modge never logs keystrokes, never captures mouse positions, never reads files, and never tracks activity outside an active work session. Screenshots are completely optional and off by default. The full privacy story is on our security page.

How fast can a team go live on Modge?

Most teams are live the same day. Install the desktop agent (about two minutes per machine), invite your team, and the productivity dashboard starts populating with the first session. The 14-day free trial includes the full feature set.

Stop guessing. Start seeing where the day really goes.

Free for 14 days, full access, no credit card. Most teams have their first "huh, that's where the time was going" moment by day three.

image